


- XRP trading volume surges 240.21%, signaling heightened market volatility.
- Legal developments with SEC add uncertainty as XRP approaches resistance.
- Technical indicators hint at a bearish trend as XRP price targets key support levels.
In a remarkable 24-hour stretch, XRP’s trading volume soared by an astonishing 240.21%, ascending to $1.84 billion. This intense trading activity unfolded within an environment of heightened market volatility that saw XRP’s price oscillate modestly upward, gaining 0.87% during the same interval.
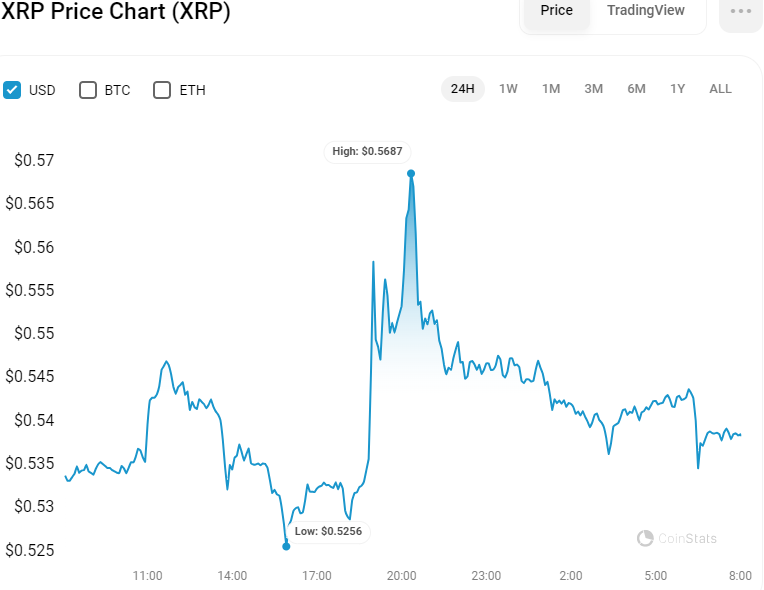
XRP/USD 24-Hour Chart (Source: CoinStats)
The turbulence is closely tied to the legal saga involving Ripple, the entity behind XRP, and the U.S. Securities and Exchange Commission (SEC). Today marks a critical deadline for the SEC to respond to Ripple’s proposed solutions concerning remedies in their ongoing legal dispute.
While the market digests these developments, the price per XRP token hovers at $0.5383 as of this report. Despite the price fluctuations, XRP’s market capitalization remains firm, rising 0.78% intraday to settle at $29.7 billion.
This yields a trading volume-to-market capitalization ratio of 6.19%, indicating robust trading activity compared to the size of XRP’s market cap. This ratio is a critical indicator of market sentiment, suggesting that while the trading activity is pronounced, it aligns with patterns observed in past periods of market uncertainty.
XRP Faces Key Technical Challenges
The XRP token has shown bullish momentum since the beginning of the month, rising by 19.12%, as indicated on the 4-hour chart. However, after reaching resistance near the $0.57 region, a price correction began, aiming to retest the 50% Fibonacci level to establish support.
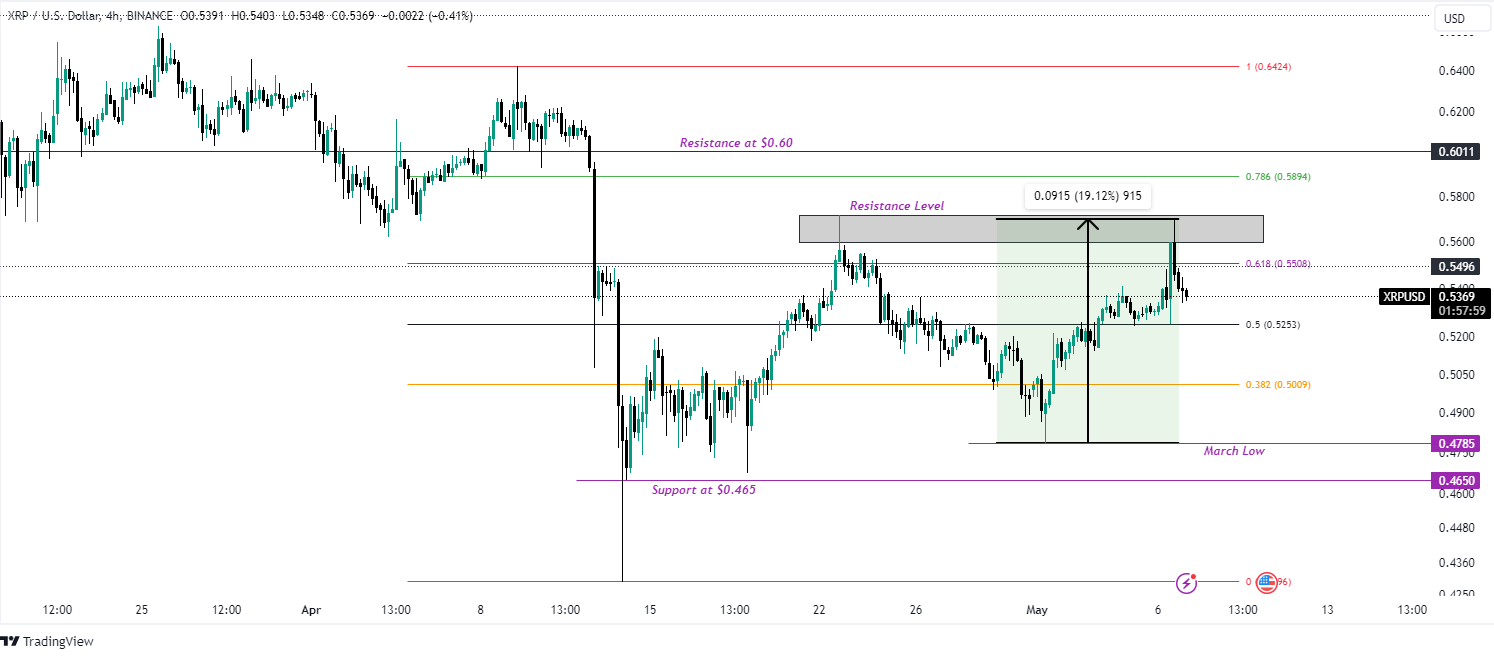
XRP/USD 4-Hour Chart (Source: Tradingview)
If this level proves resilient, the price of XRP could stage another bullish rally, potentially surpassing the $0.57 resistance area. Breaching this level could open the door for XRP to target the $0.60 resistance level.
Conversely, if the 50% Fibonacci level is breached, the XRP price might slide further to find support at the 38.2% Fibonacci level, which serves as a low-level safety net. A breach at this point could push XRP prices down to the March low, marking a significant pullback.
On the technical side, the MACD indicator is trending downward, positioned at 0.0054, signifying a weakening bullish momentum. This could indicate a market shift where bears start to take control in the short term.
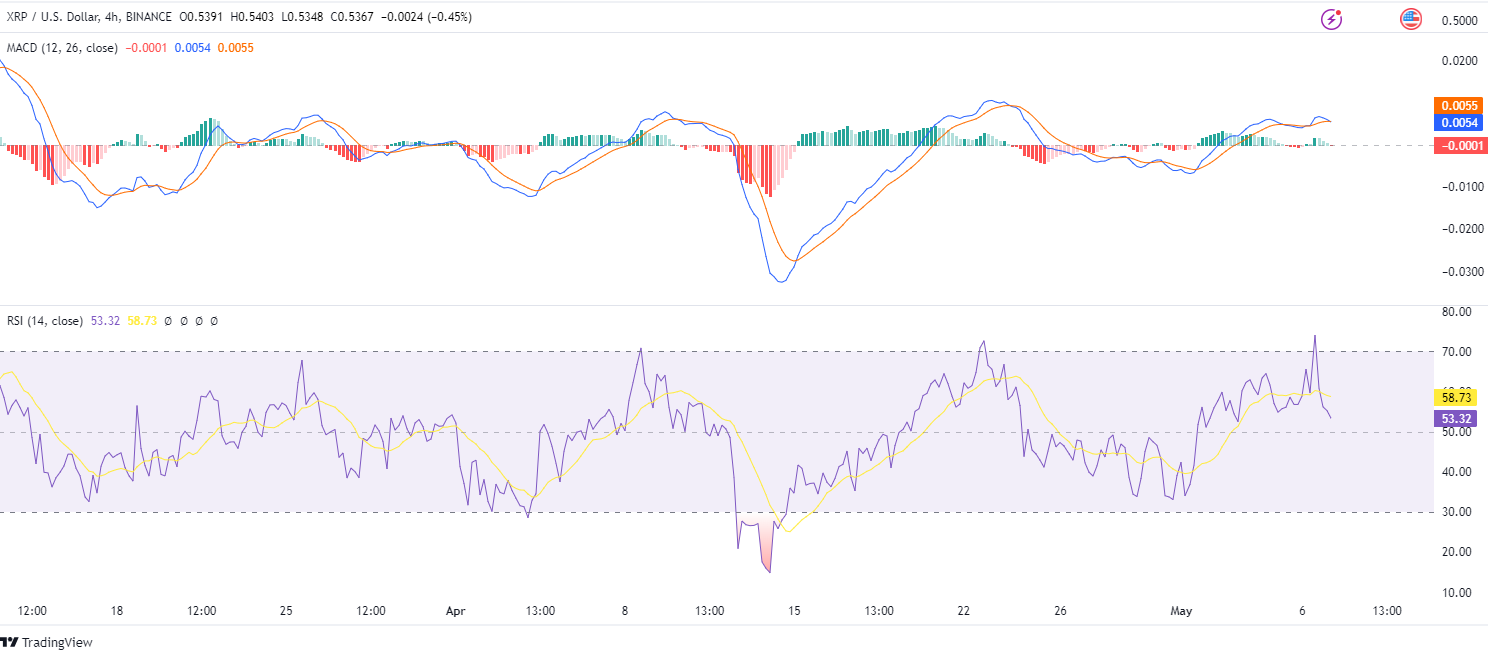
XRP/USD 4-Hour Chart (Source: Tradingview)
Additionally, the MACD line has subtly dipped beneath the signal line, heralding a likely downturn. The shrinking MACD histogram bars, which mirror prevailing market sentiment, edge closer to the zero thresholds, hinting at waning purchasing momentum and an imminent pivot towards selling pressure.
In alignment with these observations, the Relative Strength Index (RSI) has departed from the overbought zone, descending in a corrective manner and signaling a prospective phase of price correction. Currently positioned at 53.32 and below the signal line, the RSI suggests a potential bearish trend as it approaches the neutral zone and continues to decline.
Disclaimer: The information presented in this article is for informational and educational purposes only. The article does not constitute financial advice or advice of any kind. Coin Edition is not responsible for any losses incurred as a result of the utilization of content, products, or services mentioned. Readers are advised to exercise caution before taking any action related to the company.


