


- EGRAG CRYPTO predicted in an X post yesterday that XRP could surge 1,160% soon.
- The trader’s bullish outlook is based on the historical pumps XRP has undergone in the past few months.
- Meanwhile, CoinMarketCap indicated that XRP was trading at $0.4971 after it recorded a 24-hour loss of 0.15%.
Cryptocurrency trader and Ripple (XRP) enthusiast ‘EGRAG CRYPTO’ shared a bold prediction for the remittance token in an X post yesterday. In the post, the trader predicted that XRP could surge 1,160%. This will see the altcoin’s price rise to around $6.7 if the bullish thesis is validated.
EGRAG CRYPTO’s extremely bullish outlook for XRP is based on the remittance token’s series of notable price movements on the 4-month chart. According to the trader, the average of these notable price movements is 1,160%. Furthermore, he noted that the $6.7 mark is within the range of $6.5 to $7, which “aligns beautifully with the Fib 1.618 level at $6.5.”
From a shorter-term time frame, the remittance token’s price recorded a slight loss. At press time, CoinMarketCap data indicated that XRP was changing hands at $0.4971. This was after it recorded a 24-hour loss of 0.15%, subsequently pushing its weekly performance down to -3.20% as well.
Meanwhile, XRP experienced a 3.50% increase in its 24-hour trading volume. This elevated the cryptocurrency’s collective daily trading volume to $772,578,036. Notably, this was the 7th highest amount of trading volume recorded throughout the past day of trading, as per CoinMarketCap data.
Investors and traders will want to take note of the fact that the remittance token was trading at its 24-hour low at press time. Meanwhile, its peak for the same period stood above the $0.50 mark at $0.5065.
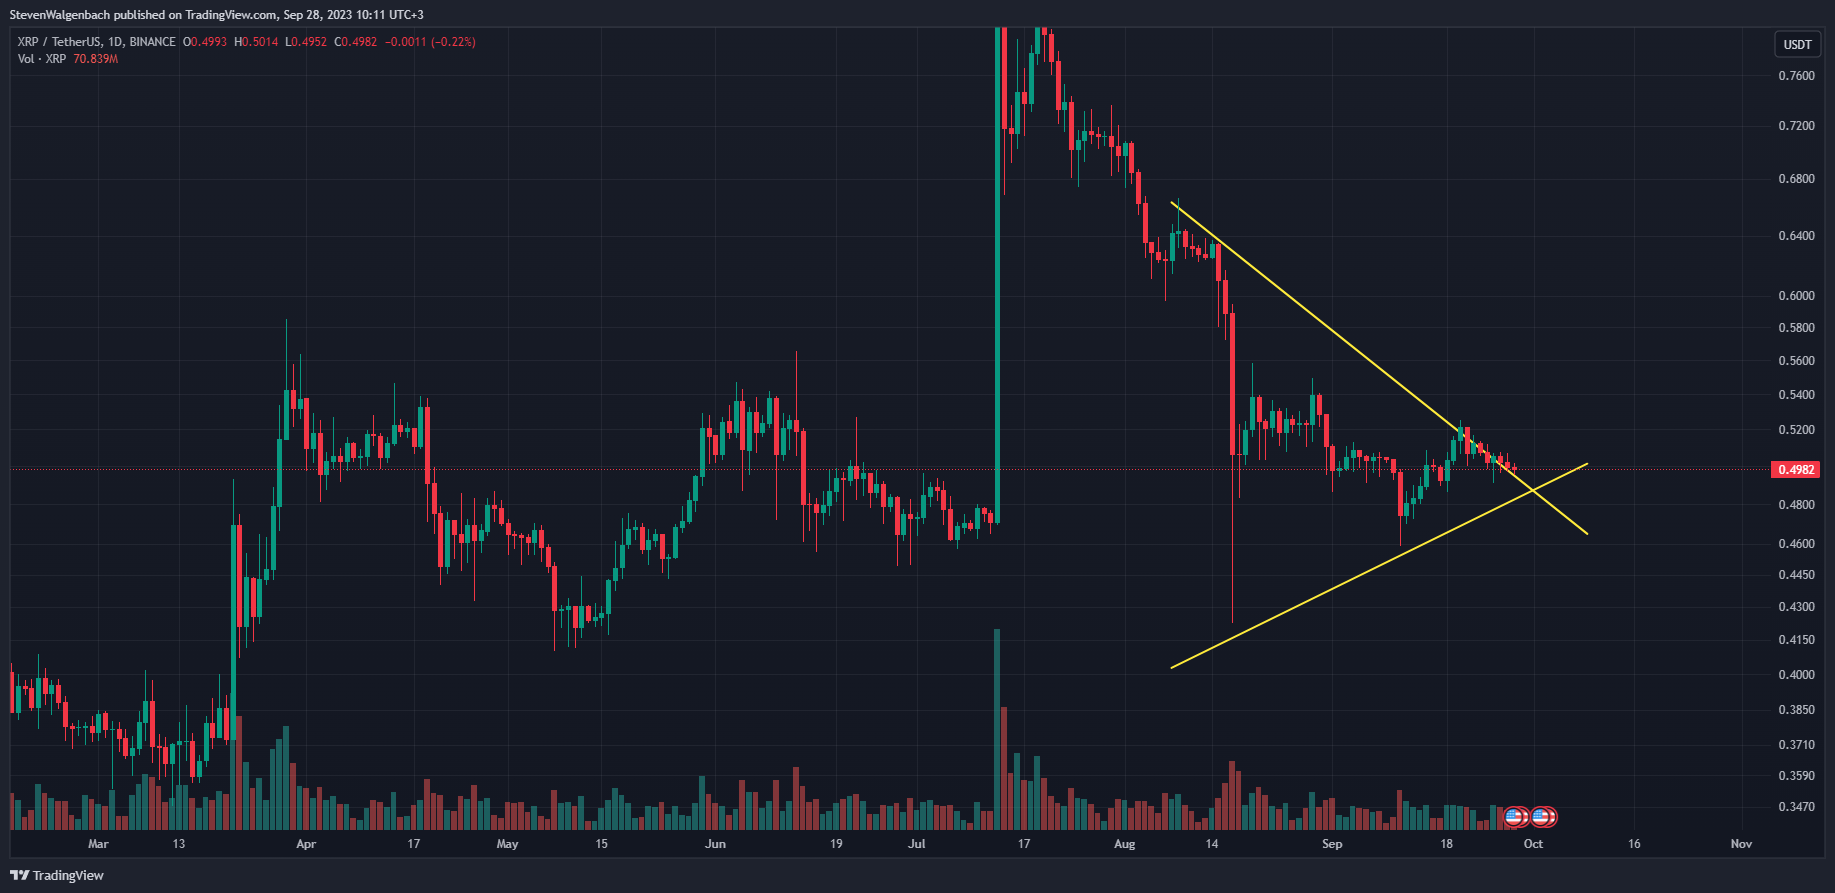
From a technical standpoint, XRP’s price had attempted to break out above a symmetrical triangle pattern that had formed on its daily chart over the past few weeks. Sellers, however, were quick to prevent any strong moves toward the upside – leading to XRP’s price retracing to just above the significant chart pattern at press time.
Disclaimer: The views and opinions, as well as all the information shared in this price analysis, are published in good faith. Readers must do their own research and due diligence. Any action taken by the reader is strictly at their own risk. Coin Edition and its affiliates will not be held liable for any direct or indirect damage or loss.
Disclaimer: The information presented in this article is for informational and educational purposes only. The article does not constitute financial advice or advice of any kind. Coin Edition is not responsible for any losses incurred as a result of the utilization of content, products, or services mentioned. Readers are advised to exercise caution before taking any action related to the company.


