


- After the recent downturn, the YFI/USD has been reduced to $5,727.
- yearn.finance price analysis shows a bearish trend, in general.
- Right now, support for the cryptocurrency is present at $5,670.
The latest yearn.finance price analysis confirms a downtrend for the day as the selling momentum has been continuously growing. The YFI/USD is trading at $5,727 and is at risk of further losses. The previous day’s high was at $5,951 which acts as a resistance level in the current market. However, the bulls were unable to sustain the breakout.
The sellers have taken the control of the market and breaking out to $5,670 could be a sign of support, and if this level is broken, YFI could find its way to $5,500. The resistance and support levels are crucial to watch in the next 24 hours as it could decide the fate of YFI/USD.
The daily YFI confirms the market’s downward trend, as the price covered bearish movement in the previous 24 hours. The already-under-pressure price has crashed again today; an unexpected decline has been experienced toward the $5,727 low, while the moving average (MA) value is standing at the $5,516 position. The coin reports a loss of 1.24 percent over the last 24 hours which is quite a significant drop.
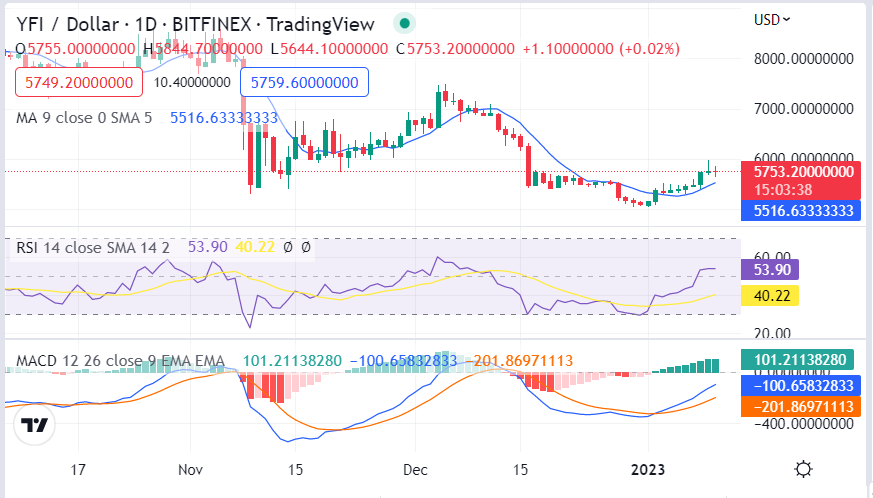
YFI/USD 24-hour trading chart: Source: TradingViewThe MACD chart has generated a bearish crossover as the signal line is trading below the MACD line, which supports the bearishness in the market. The current RSI value is standing at 40.22, which indicates a lack of buyers in the market and puts YFI/USD under the bearish cycle.
The four-hour yearn.finance price analysis shows a continuous decline in the coin’s value, as a massive fall has been observed in the past few hours. This is because the bears have made a comeback and are striving hard to win back their lead. The selling momentum is increasing, which is why the coin value leveled off at $5,727. The sudden bearish sweep has had devastating effects on the buyers. The moving average value is to cross below the SMA 50 curve, which is currently present at the $5,783 mark.
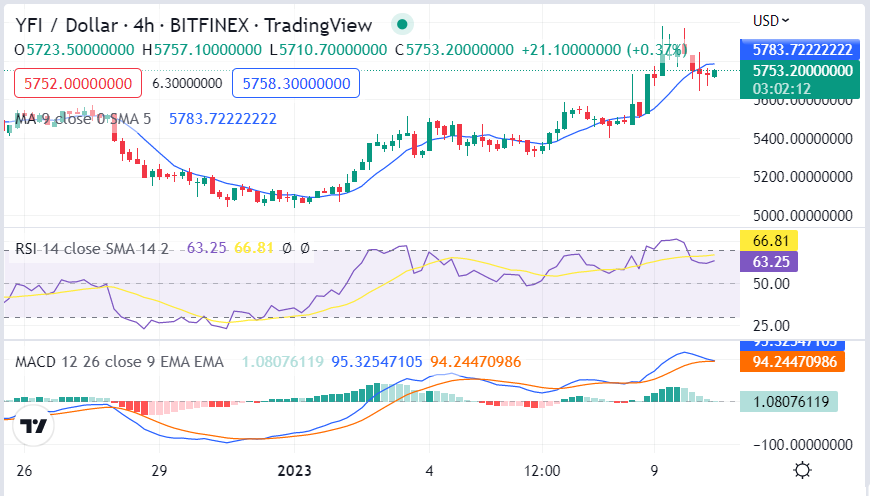
YFI/USD 4-hour trading chart: Source: TradingViewThe downward trend is expected to extend further in the next few hours. The Relative Strength Index (RSI) graph shows a bearish curve as the score keeps dropping and has reduced to index 66.81. The MACD chart is also in the bearish zone, which confirms the downtrend. The orange line has crossed the blue line, and this signifies that the bears are reinforcing their grip.
Overall, YFI/USD is currently trading in a bearish zone, and the pair may extend its losses further in the next 24 hours. The buyers must remain cautious while trading and must be ready to face a further dip in price.
Disclaimer: The views and opinions, as well as all the information shared in this price prediction, are published in good faith. Readers must do their research and due diligence. Any action taken by the reader is strictly at their own risk. Coin Edition and its affiliates will not be held liable for any direct or indirect damage or loss.
Disclaimer: The information presented in this article is for informational and educational purposes only. The article does not constitute financial advice or advice of any kind. Coin Edition is not responsible for any losses incurred as a result of the utilization of content, products, or services mentioned. Readers are advised to exercise caution before taking any action related to the company.


