 Records All-Time High as Price Skyrockets Over 35%")
- ZetaChain surged 38.97% in 24 hours, reaching a new high of $2.39 amid crypto market optimism.
- ZETA’s RSI at 80 suggests overbought conditions, hinting at a potential correction.
- MACD indicates a solid bullish trend for ZETA, supporting further price gains.
ZetaChain (ZETA) has been on a positive streak over the last 24 hours, propelled by crypto market optimism following Bitcoin’s three-year high. As a result, the ZETA price has risen from an intraday low of $1.65 to an all-time high of $2.39 before encountering resistance. At press time, ZETA was trading at $2.33, up 38.97% from the day’s low and 86.55% in the previous week.
This price gain is due to increased interest and demand for ZetaChain as investors perceive the cryptocurrency’s potential for growth. Furthermore, the positive emotion surrounding Bitcoin’s recent success has encouraged trust in the whole crypto industry, increasing investment in altcoins such as ZETA.
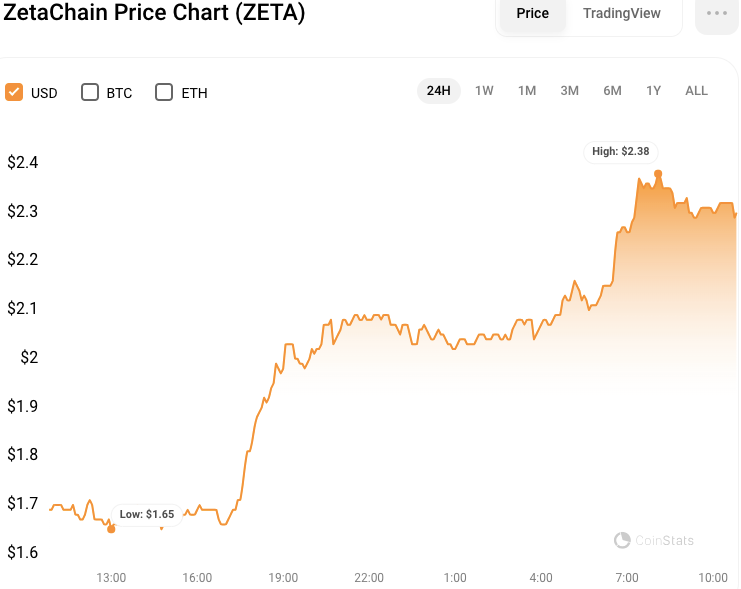
Concurrently, ZETA’s market capitalization and 24-hour trading volume increased by 38.17% and 79.42%, respectively, to $548,986,397 and $163,073,616.
ZETA/USD Technical Analysis
The Relative Strength Index (RSI) rating of 80 on the ZETAUSD 4-hour price chart suggests that the cryptocurrency is overbought, implying a possible correction shortly. Despite this overbought scenario, ZetaChain’s strong momentum and bullish enthusiasm may raise its price.
If the optimistic sentiment persists, ZETA may break over its all-time high and reach new price levels. However, investors should exercise caution, as the overbought condition may result in a short-term fall or consolidation of the market.
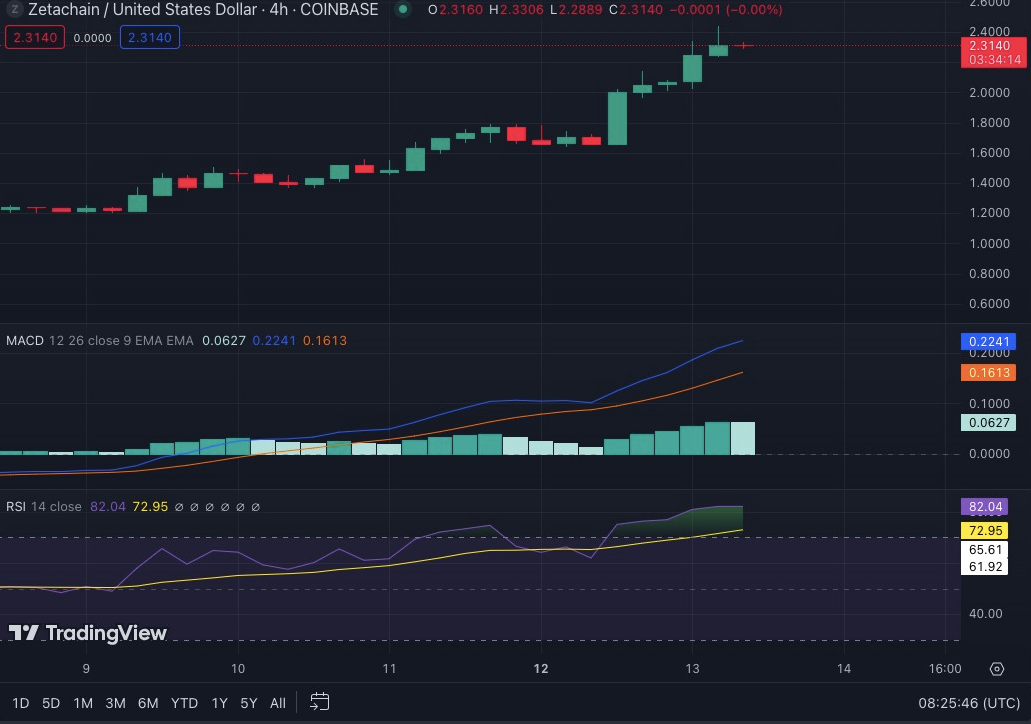
The Moving Average Convergence Divergence (MACD) indicator is in the positive range with a reading of 82.18, indicating a strong bullish trend for ZETA. This trend adds to the potential of the price breaking through its previous all-time high.
In addition, the MACD histogram also exhibits an increasing trend, indicating that purchasing pressure is building. If the MACD indicator shows positive readings and the histogram continues to rise, ZETA’s price may experience a persistent upward trend.
Disclaimer: The information presented in this article is for informational and educational purposes only. The article does not constitute financial advice or advice of any kind. Coin Edition is not responsible for any losses incurred as a result of the utilization of content, products, or services mentioned. Readers are advised to exercise caution before taking any action related to the company.


