


 Price Prediction 2024-2030: Will ZETA Break New Highs?")
ZetaChain (ZETA) has recently seen dynamic movements, causing significant fluctuations in its price. As it gains attention in the crypto world, investors and analysts alike are curious about what the future holds for ZETA. Let’s delve into an in-depth analysis of ZetaChain’s current market status and what predictions indicate for its price trajectory up to 2030.
Table of contents
- ZetaChain (ZETA) Market Status
- What is ZetaChain (ZETA)?
- ZetaChain (ZETA) Price Prediction 2024-2030 Overview
- ZetaChain (ZETA) Price Prediction and Analysis
- ZetaChain (ZETA) Price Predictio 2024
- ZetaChain (ZETA) Price Prediction 2025
- ZetaChain (ZETA) Price Prediction 2026
- ZetaChain (ZETA) Price Prediction 2027
- ZetaChain (ZETA) Price Prediction 2028
- ZetaChain (ZETA) Price Prediction 2029
- ZetaChain (ZETA) Price Prediction 2030
- FAQs
ZetaChain (ZETA) Market Status
ZetaChain (ZETA) currently sits at rank #153 on CoinMarketCap, with a price of $0.6514 and a 24-hour trading volume of $101.80 million. Over the past day, ZETA has experienced a slight dip in price by approximately 9.28%. However, the market cap continues to show strength, indicating ongoing interest in the project.

What is ZetaChain (ZETA)?
ZetaChain is an innovative blockchain platform designed to support cross-chain interactions, enabling seamless transactions between different blockchain networks. This capability allows ZetaChain to stand out by providing an interoperable infrastructure, attracting developers and investors aiming to bridge the gap between various blockchain ecosystems.
With a unique approach to scalability and interoperability, ZetaChain aims to redefine how decentralized applications operate across blockchains. This cross-chain connectivity has fueled interest, positioning ZETA as a promising asset in the blockchain space.
ZetaChain (ZETA) Price Prediction 2024-2030 Overview
| Year | Potential Low ($) | Potential High ($) |
| 2024 | $0.80 | $1.20 |
| 2025 | $1.10 | $1.50 |
| 2026 | $1.40 | $1.80 |
| 2027 | $1.60 | $2.10 |
| 2028 | $2.00 | $2.50 |
| 2029 | $2.30 | $2.80 |
| 2030 | $2.50 | $3.00 |
ZetaChain (ZETA) Price Prediction and Analysis
ZetaChain’s recent price movement showcases a volatile pattern, capturing the attention of both short-term traders and long-term investors. Although it has seen a dip, the broader outlook remains optimistic, with multiple factors supporting potential growth in the coming years.
ZetaChain (ZETA) Price Prediction: What’s Next?
Looking at an in-depth analysis, the chart shows a completed falling wedge pattern, a bullish reversal indicator, where the price has been converging within two downward-sloping trendlines. This pattern typically suggests a potential breakout to the upside once the price breaches the upper trendline, which seems to have occurred in this case.
The Relative Strength Index (RSI) is currently at 44.98, slightly below the midpoint (50), indicating a neutral to slightly bearish momentum. However, the RSI has recently crossed below its moving average, suggesting that selling pressure is still present, and a further decline may occur before a stronger recovery. The price has previously found support around the $0.6200 level within the wedge pattern. This zone acted as a base, from which the price bounced to retest higher levels.

Immediate resistance is seen at $0.6800, a level previously tested during the breakout from the falling wedge. If the price manages to break through this resistance, it could aim for $0.7000 as the next significant level. ZetaChain is currently trading near $0.6506, facing slight selling pressure after the breakout. Although the breakout from the falling wedge is typically a bullish sign, the lack of strong volume may hinder an immediate rally.
If buying momentum increases, especially with higher trading volumes, ZETA may attempt to move towards $0.6800 and potentially test the psychological level of $0.7000. Should the RSI continue trending downwards, there is a possibility that ZETA might retest the $0.6200 support zone, where buyers may step in again. If this support fails, further downside could be expected.
ZetaChain (ZETA) Price Prediction: Moving Averages
Deeper analysis show that positioned around $0.6624, the 50-period simple moving average (SMA) serves as a short-term resistance level. Currently, the price has dipped below this SMA, which could indicate a potential continuation of bearish momentum. Located at approximately $0.6608, the 100 SMA also aligns with the current price level, suggesting a confluence of resistance. A move above both the 50 and 100 SMAs could signal a recovery, but failure to break above may indicate persistent selling pressure. At around $0.6304, the 200 SMA is acting as a longer-term support level. If the price continues to decline, this level might offer significant support, where buyers could potentially step in.
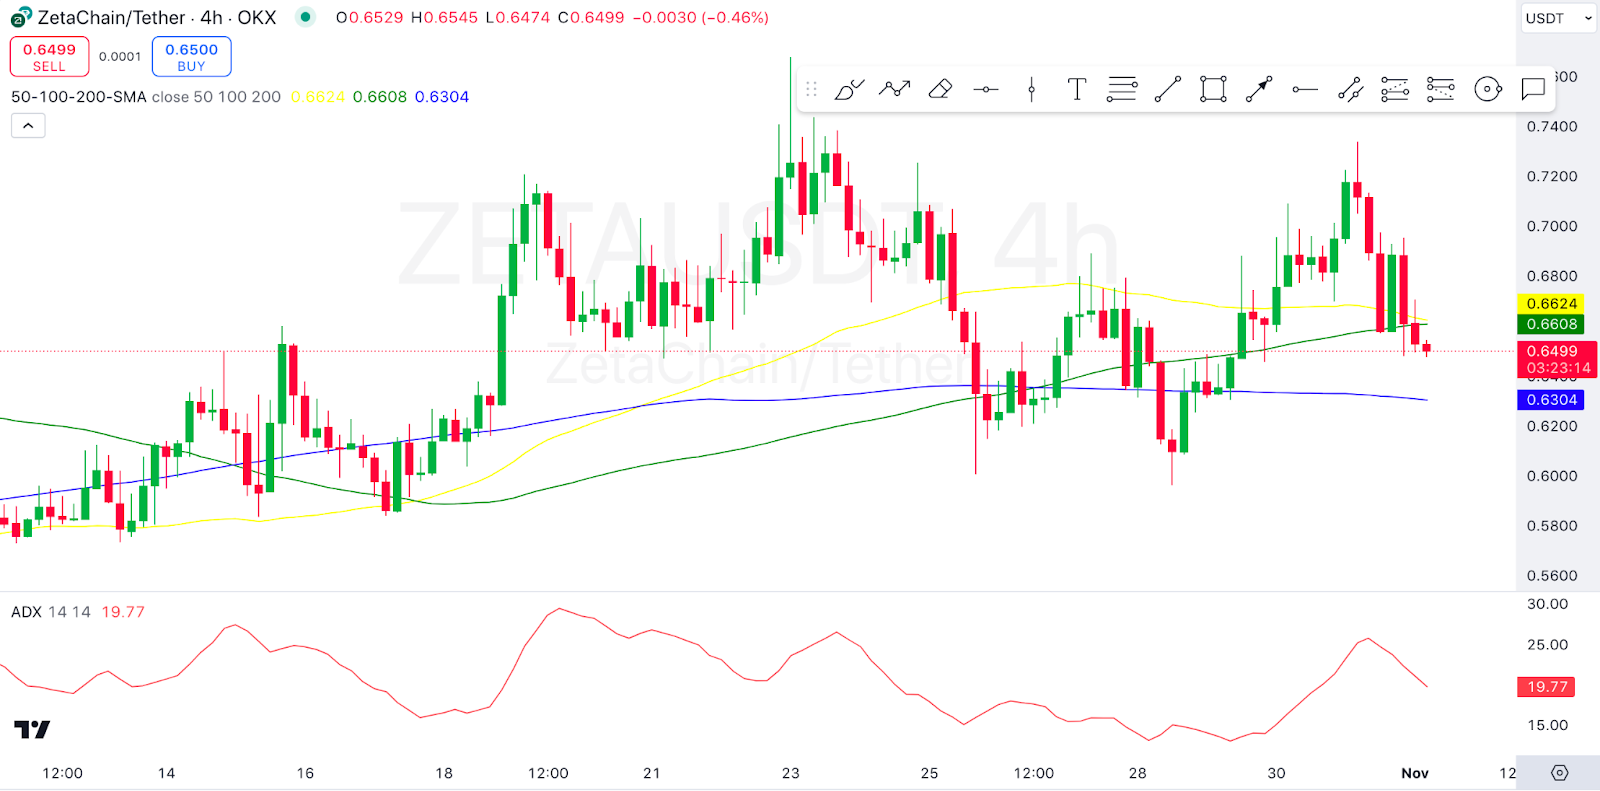
On the other hand we see that, the ADX Indicator (Average Directional Index) is currently at 19.77, which suggests weak trend strength. An ADX below 20 often indicates a lack of strong directional momentum in either direction. This aligns with the price consolidating and facing resistance at the 50 and 100 SMAs, implying a period of indecision and consolidation.

ZetaChain is currently trading around $0.6499, just below the 50 and 100 SMAs, which has put pressure on bullish momentum. This area may act as a resistance zone in the short term. For ZETA to see a bullish reversal, it would need to break and hold above the 50 and 100 SMAs. If the price fails to maintain current levels, it could test the 200 SMA support around $0.6300, which might offer a stronger base for a potential bounce. A decisive breakout above the 50 and 100 SMAs, with a rising ADX, could signal a shift in momentum and initiate a move toward the $0.6800 resistance level.
ZetaChain (ZETA) Price Predictio 2024
ZetaChain (ZETA) is expected to experience moderate growth, primarily driven by its unique positioning in the cross-chain interoperability space. With increasing demand for solutions that bridge different blockchains, ZETA could see a gradual price rise. Predictions for 2024 suggest a potential trading range between $0.80 and $1.20.
ZetaChain (ZETA) Price Prediction 2025
As blockchain interoperability becomes more critical, ZetaChain may experience a surge in adoption, potentially pushing its price to a high of $1.50. Increased network usage and developer integrations could lead to price stabilization around $1.10, setting the stage for further growth.
ZetaChain (ZETA) Price Prediction 2026
The growth momentum for ZETA might continue in 2026, with price predictions suggesting a range between $1.40 and $1.80. With sustained demand for cross-chain applications, ZetaChain’s value proposition could attract new investors.
ZetaChain (ZETA) Price Prediction 2027
By 2027, ZetaChain could benefit from broader market adoption and technological advancements, pushing the price to a potential high of $2.10. A low estimate of $1.60 reflects ongoing interest as the platform gains recognition for its cross-chain capabilities.
ZetaChain (ZETA) Price Prediction 2028
In 2028, ZetaChain’s price might range between $2.00 and $2.50, driven by sustained interest in cross-chain applications. As blockchain integration becomes mainstream, ZETA could establish itself as a preferred solution.
ZetaChain (ZETA) Price Prediction 2029
With ZetaChain’s network expected to mature by 2029, the price could consolidate within the range of $2.30 to $2.80. This stability indicates ZETA’s growing reputation and utility, making it a reliable asset in the cross-chain ecosystem.
ZetaChain (ZETA) Price Prediction 2030
By 2030, ZetaChain could reach new heights, with potential prices between $2.50 and $3.00. This growth reflects the maturity of the cryptocurrency market and ZetaChain’s established role within it.
FAQs
ZetaChain (ZETA) is a blockchain platform enabling seamless cross-chain transactions, providing a unique infrastructure for developers to build interoperable applications.
The price of ZETA can be influenced by blockchain adoption, technological advancements, regulatory changes, and demand for interoperability.
Given its focus on cross-chain connectivity, ZetaChain holds potential for long-term growth, making it a promising investment in the blockchain space.
Long-term growth may be driven by increased adoption, technological innovations, and favorable regulatory support, enabling ZetaChain to scale and integrate across various blockchain ecosystems.
Disclaimer: The information presented in this article is for informational and educational purposes only. The article does not constitute financial advice or advice of any kind. Coin Edition is not responsible for any losses incurred as a result of the utilization of content, products, or services mentioned. Readers are advised to exercise caution before taking any action related to the company.
 Price Prediction: Can BTW Sustain Its Breakout Above $0.1032?")


