


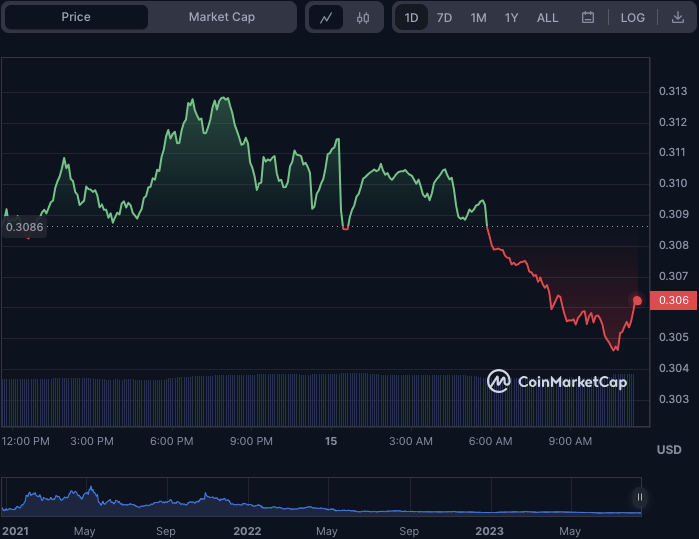
- 1INCH faces resistance at $0.3131 and finds support at $0.3045 in the last 24 hours.
- Bearish signals persist for 1INCH despite oversold MFI suggesting relief.
- Rising RSI hints at possible short-term 1INCH recovery.
Bullish momentum in the 1inch Network (1INCH) weakened when the 24-hour high of $0.3131 was tested. The price failed to break above this level, resulting in a minor market downturn.
Consequently, bears took control of the 1INCH market, lowering the price to an intraday low of $0.3045 until buyers stepped in and provided support. At the time of publication, 1INCH was trading at $0.3063, indicating a slight rebound from the intraday low.
During the drop, the market capitalization of 1INCH fell by 0.86% to $315,284,827, but its 24-hour trading volume increased by 11.40% to $18,400,820. Despite the price drop, the rise in trade volume implies more significant activity and interest in the 1INCH market. It shows that traders are actively buying and selling, which might indicate a possible rebound soon.
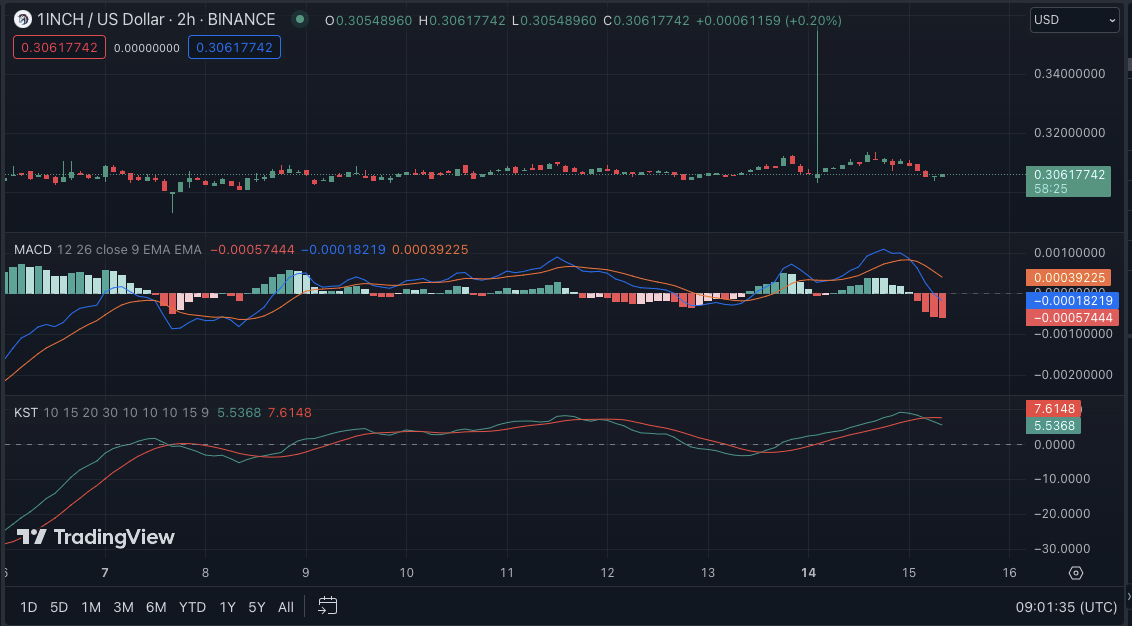
With a score of -0.00057444, the Moving Average Convergence Divergence (MACD) trend for 1INCH is in the negative range, suggesting a bearish gauge. This movement indicates that selling pressure is more significant than purchasing pressure, which might lead to additional price decreases.
In addition to the negative attitude, the histogram generated a succession of lower bars, suggesting a drop in bullish momentum. This movement shows that 1INCH may have an additional negative potential.
The Know Sure Thing (KST) at 5.5368 has shifted below its signal line, adding to the bearish picture for 1INCH. The KST is a momentum oscillator that gauges the rate of change in price movements; a value below the signal line suggests a likely downward trend reversal. This track shows that 1INCH may suffer more selling pressure and price decreases if bulls don’t stage a comeback.
However, the Money Flow Index (MFI) rating of 14.05 indicates that the negative momentum is diminishing. When the MFI falls below the oversold level of 20, selling pressure may ease, and buyers may enter the market. This move may result in a slight relief rally or consolidation in the price of 1INCH before any further decline.
The Relative Strength Index of 43.40 is increasing, indicating that the selling pressure is weakening. The rising RSI signals a possible shift in market mood toward purchasing, which might support a short-term rebound in the price of 1INCH. However, if selling pressure persists and the RSI falls below 30, it may imply additional downward action in the market.
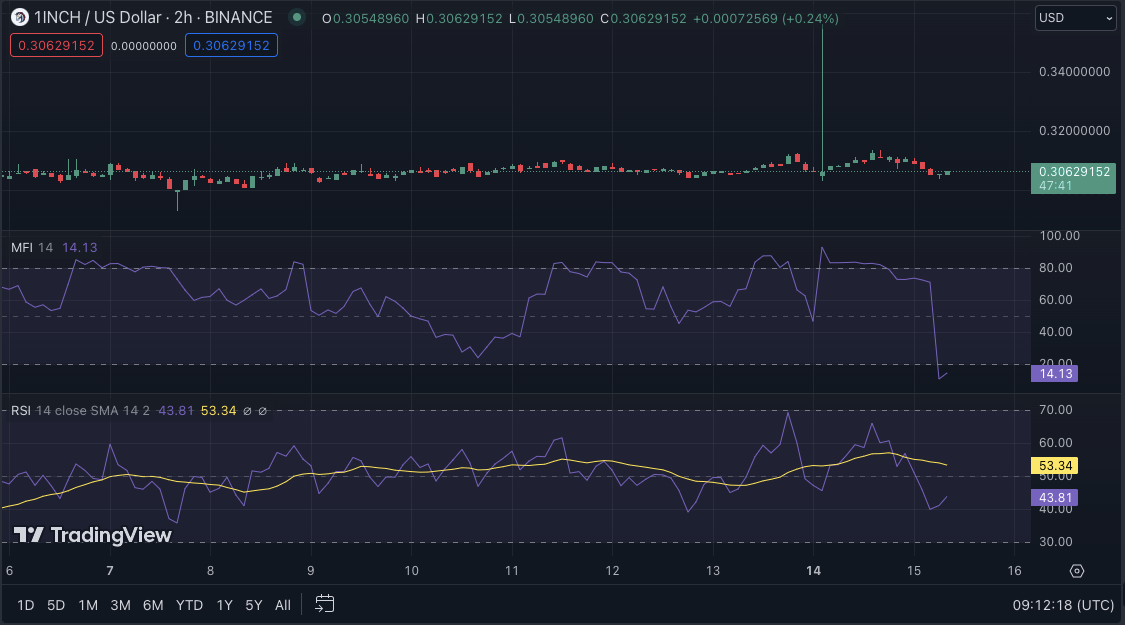
In conclusion, while 1INCH faces bearish challenges, rising RSI and diminishing selling pressure hint at the potential for a short-term rebound.
Disclaimer: The views, opinions, and information shared in this price prediction are published in good faith. Readers must do their research and due diligence. Any action taken by the reader is strictly at their own risk. Coin Edition and its affiliates will not be liable for direct or indirect damage or loss.
Disclaimer: The information presented in this article is for informational and educational purposes only. The article does not constitute financial advice or advice of any kind. Coin Edition is not responsible for any losses incurred as a result of the utilization of content, products, or services mentioned. Readers are advised to exercise caution before taking any action related to the company.

: What Happens If You Use an Unlicensed Platform?")


