


- A surge past the overhead resistance could send SHIB toward $0.000042.
- FLOKI might climb by another 30% while BONK’s buy signal appeared at $0.000027.
- The EMA indicated a bullish trend for DOGE but WIF needs a positive CMF to validate its bullish thesis.
Over the last few weeks, meme coins have been running hard and outperforming almost every other sector of the crypto economy. While the bullish momentum had slowed down a little, it did not seem like the coins were done rising.
For instance, CoinMarketCap data showed that Shiba Inu’s (SHIB) price climbed by 5.33% in the last 24 hours. Floki (FLOKI) pumped by 30.19% while Bonk (BONK) recovered to hit $0.000031.
Others including Dogecoin (DOGE) and dogwifhat (WIF) saw their values rise by 6.35% and 9.94% within the same period. If the meme coins maintain this momentum, the prices might continue to climb. However, it is important to look at it from a technical angle
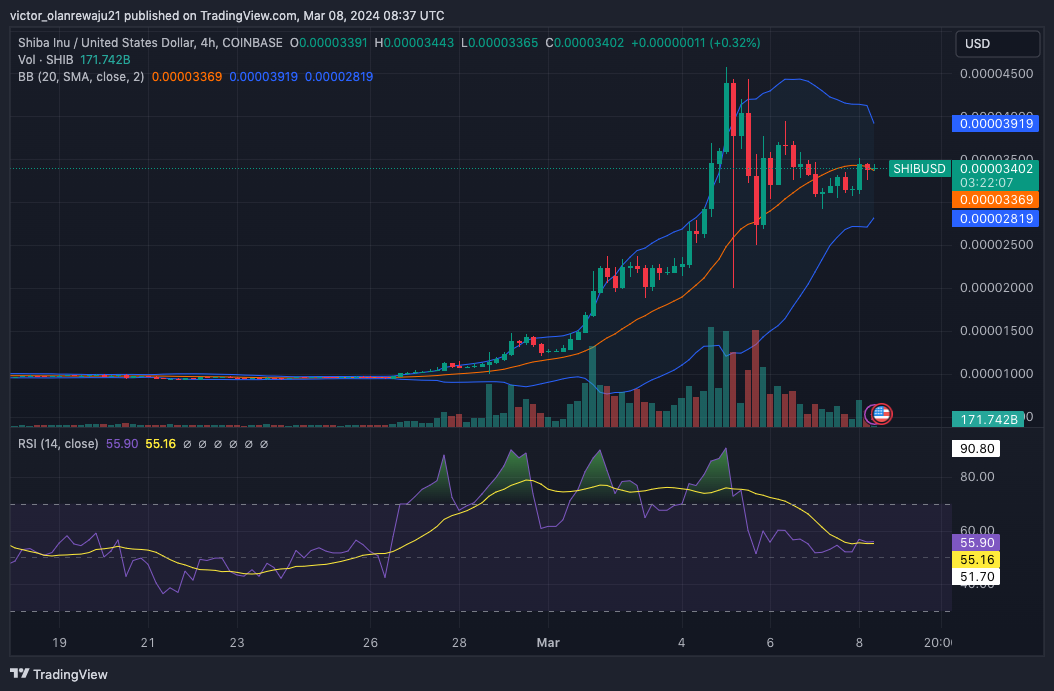
SHIB
On the 4-hour timeframe, bears had resisted the attempt to push SHIB’s price to $0.000035. However, bulls seemed to be banking on the $0.000032 support to ensure the attempt was successful.
Furthermore, the Bollinger Bands (BB) showed that volatility around the token remained extremely high. With the band expansion, the indicator showed that SHIB could rise above $0.000042. But that would only happen if the token could surge past the overhead resistance at $0.000037.
However, the potential price fluctuation could also lead to a drawdown. If selling pressure increases, SHIB could slide below $0.000030. In addition, the RSI reading had remained flat suggesting indecisiveness in traders. With this momentum, SHIB’s price might continue to consolidate.
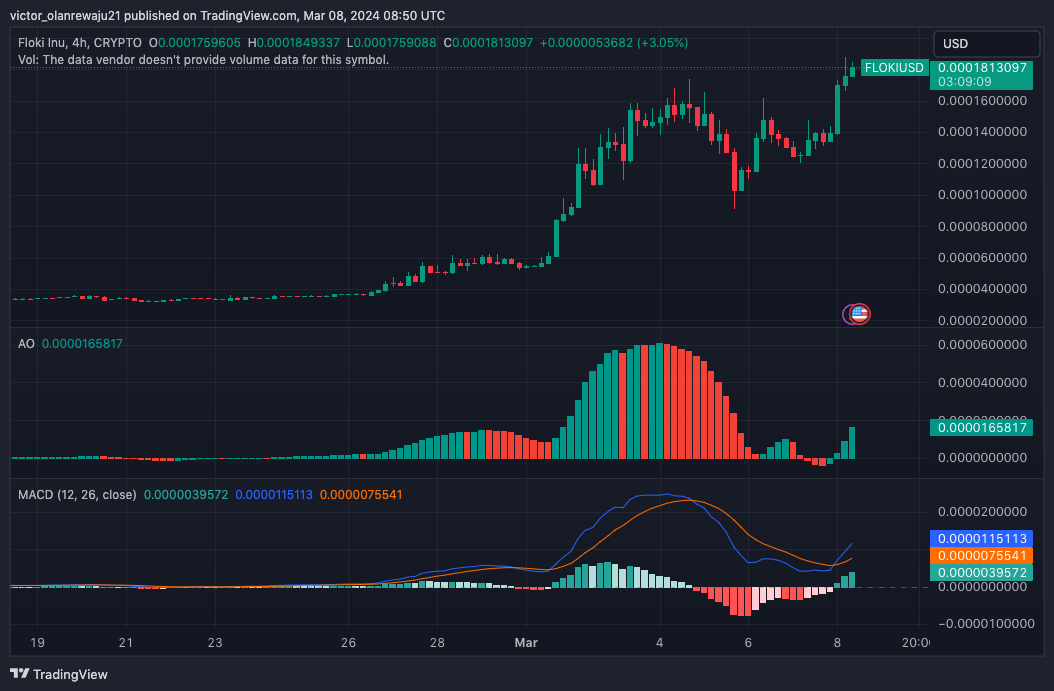
FLOKI
From a technical perspective, the Awesome Oscillator (AO) left the negative territory and was 0.000016 at press time. The flip into the positive region meant that FLOKI’s momentum had been increasing.
Concerning the price action, the AO reading could help foreshadow a higher price for the meme coin. If this is the case, FLOKI’s price might reach $0.000025. Coin Editon also looked at the Moving Average Convergence Divergence (MACD).
At press time, the MACD reading was positive, indicating a bullish momentum for the token. If this remains the case, FLOKI’s price might climb more than 30% within the next few weeks.
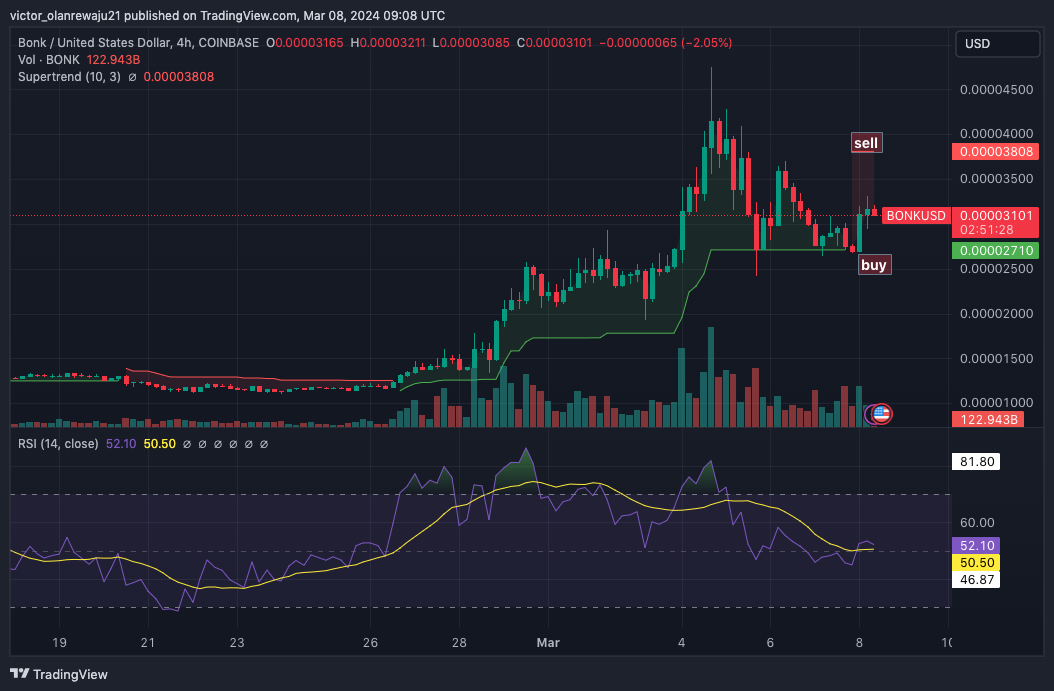
BONK
The BONK/USD 4-hour chart was similar to SHIB. As of this writing, BONK’s price was $0.000030. According to the Supertrend indicator, a sell signal appeared at $0.000038, and it was one of the reasons BONK’s price fell.
However, the Supertrend indicator flashed another buy signal. But this time, it was at $0.000027. Therefore, if BONK nosedives downwards, traders might find a good entry at $0.000027 before it rebounds.
Like SHIB, the RSI on the BONK chart displayed hesitation in buying or selling. Therefore, the price might trade sideways for a while before it breaks out.
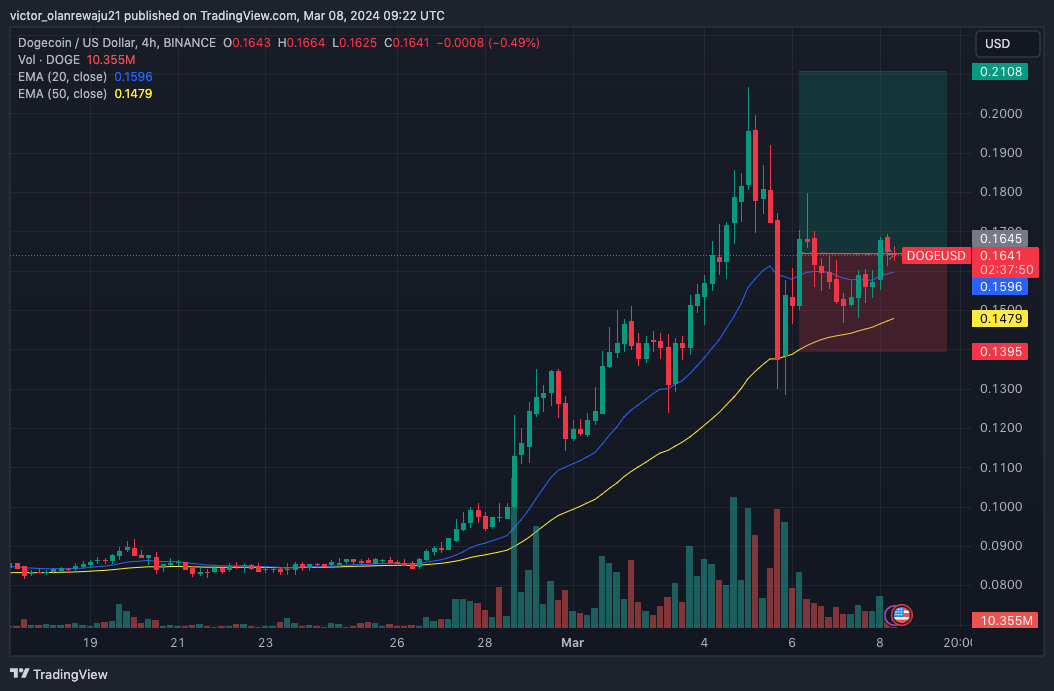
DOGE
As of this writing, Dogecoin changed hands at $0.16. However, indications from the Exponential Moving Average (EMA) showed that the value could rise higher. This was because the 20 EMA (blue) had crossed above the 50 EMA (yellow).
This trend is considered bullish. But to avoid being invalidated, DOGE’s price needs to stay above both EMAs. If DOGE falls below $0.15, the bullish prediction could be invalidated.
However, failure to decrease further could send DOGE higher. In a highly bullish case, Dogecoin might trade above $0.21.
WIF
At press time, WIF has surpassed its all-time high. Despite the price increase, the RSI showed that WIF was not overbought. According to the 4-hour chart, the RSI reading was 62.95, indicating a good buying momentum for the memecoin.
Should the buying momentum continue to surge, then WIF’s price might continue to swing upwards. If this is the case, WIF might rally toward $3.
However, the Chaikin Money Flow (CMF) dropped into the negative region. If the CMF was positive, it would have implied an increase in capital flow which is supposed to drive a higher value.
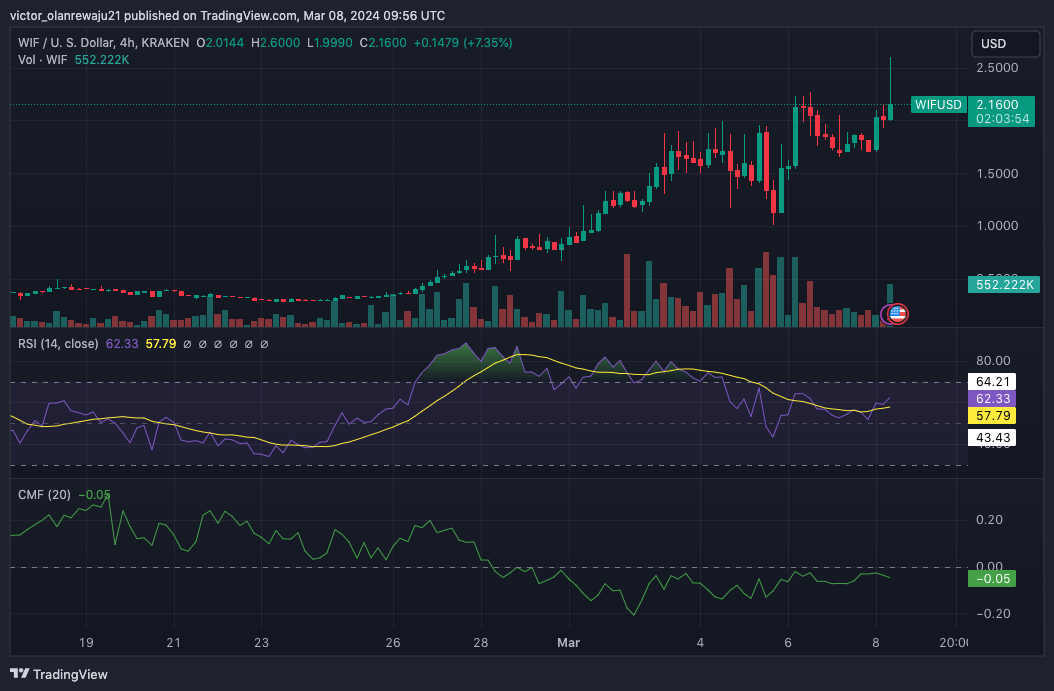
Therefore, the negative reading of CMF meant that market participants were taking liquidity out of WIF. If capital flows back, then WIF’s rise to $3 could be validated. If not, the price could move between $2 and $2.5.
Disclaimer: The information presented in this article is for informational and educational purposes only. The article does not constitute financial advice or advice of any kind. Coin Edition is not responsible for any losses incurred as a result of the utilization of content, products, or services mentioned. Readers are advised to exercise caution before taking any action related to the company.

: What Happens If You Use an Unlicensed Platform?")


