- XRP, LINK & 3 more altcoins test make-or-break support levels now
- Oversold RSI in XRP, TEL prompts analysts to watch for bounce opportunity
- Analysts watch if critical support holds; key test for reversal in 5 altcoins
Five key altcoins show critical technical setups as the broader crypto market consolidates. XRP, Chainlink (LINK), Hedera (HBAR), Telcoin (TEL), and Celestia (TIA) currently test significant support levels or face immediate resistance.
Their individual chart patterns hint at potential upcoming volatility and this report breaks down the current technical picture for each asset.
Oversold XRP Tests Key Support After Latest Correction
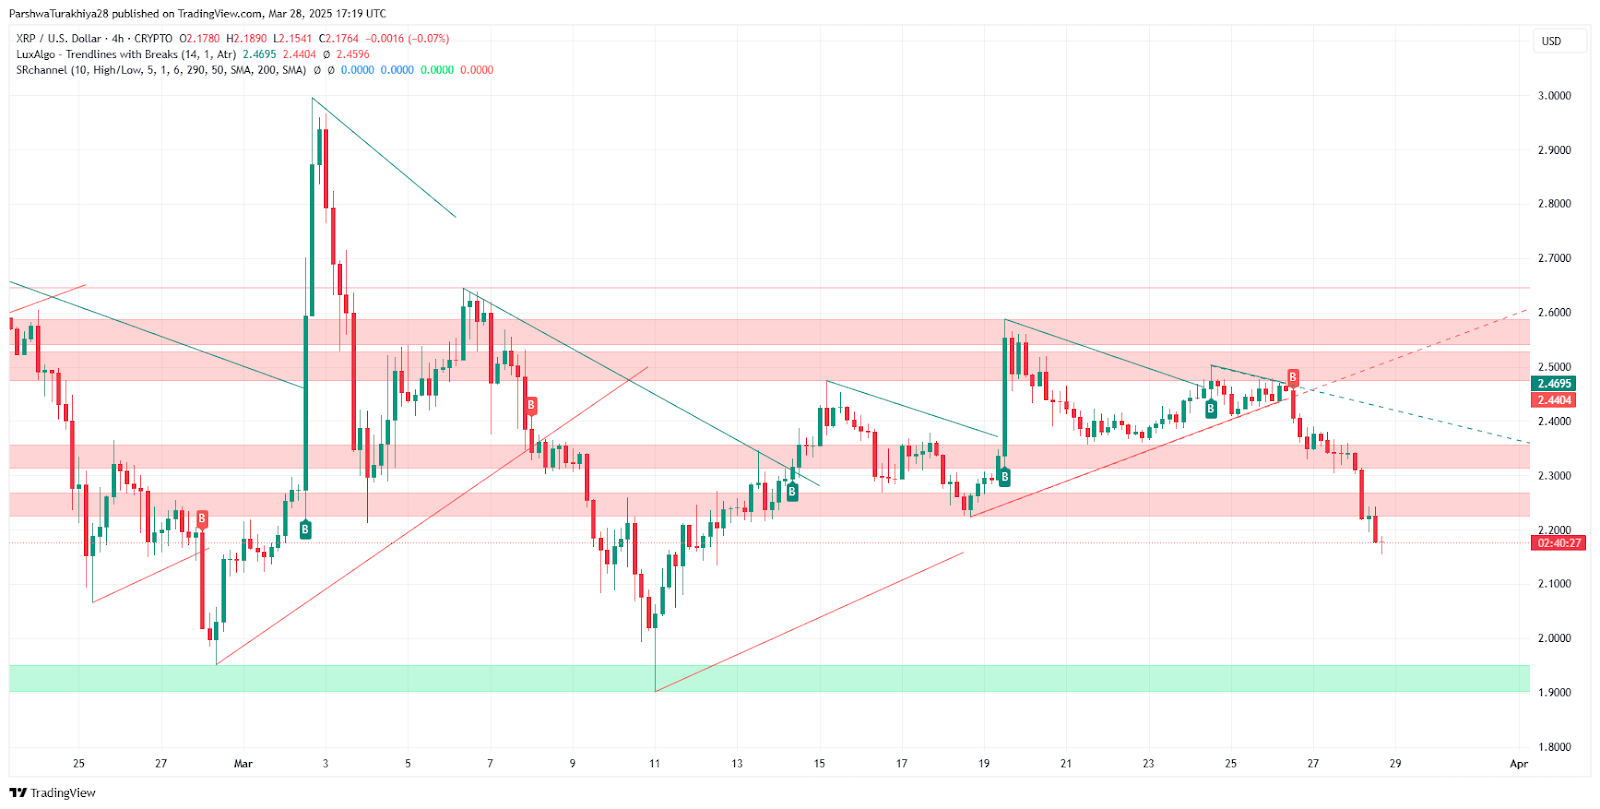
XRP corrected sharply after breaking down from a rising wedge pattern previously formed near $2.47. The price currently trades around $2.17, operating below the previous $2.30 support level which now likely acts as overhead resistance.
While major EMAs currently trend downward and the MACD indicator remains bearish, the Relative Strength Index (RSI) has plunged to a reading near 20.85. Such deeply oversold RSI levels sometimes suggest selling pressure may be nearing exhaustion, potentially setting the stage for price stabilization or a relief bounce.
XRP now tests its next significant demand zone identified between $2.10–$2.15. Holding this area will be crucial for potentially negating further immediate downside. If this zone fails to attract buyers, the focus could then shift down towards the well-established long-term support level located near $1.95.
Related: These Altcoins Show Strength: Which Could Actually Retest Highs? (Analysis)
Chainlink (LINK): Rising Wedge Breakdown Signals Bearish Trend?
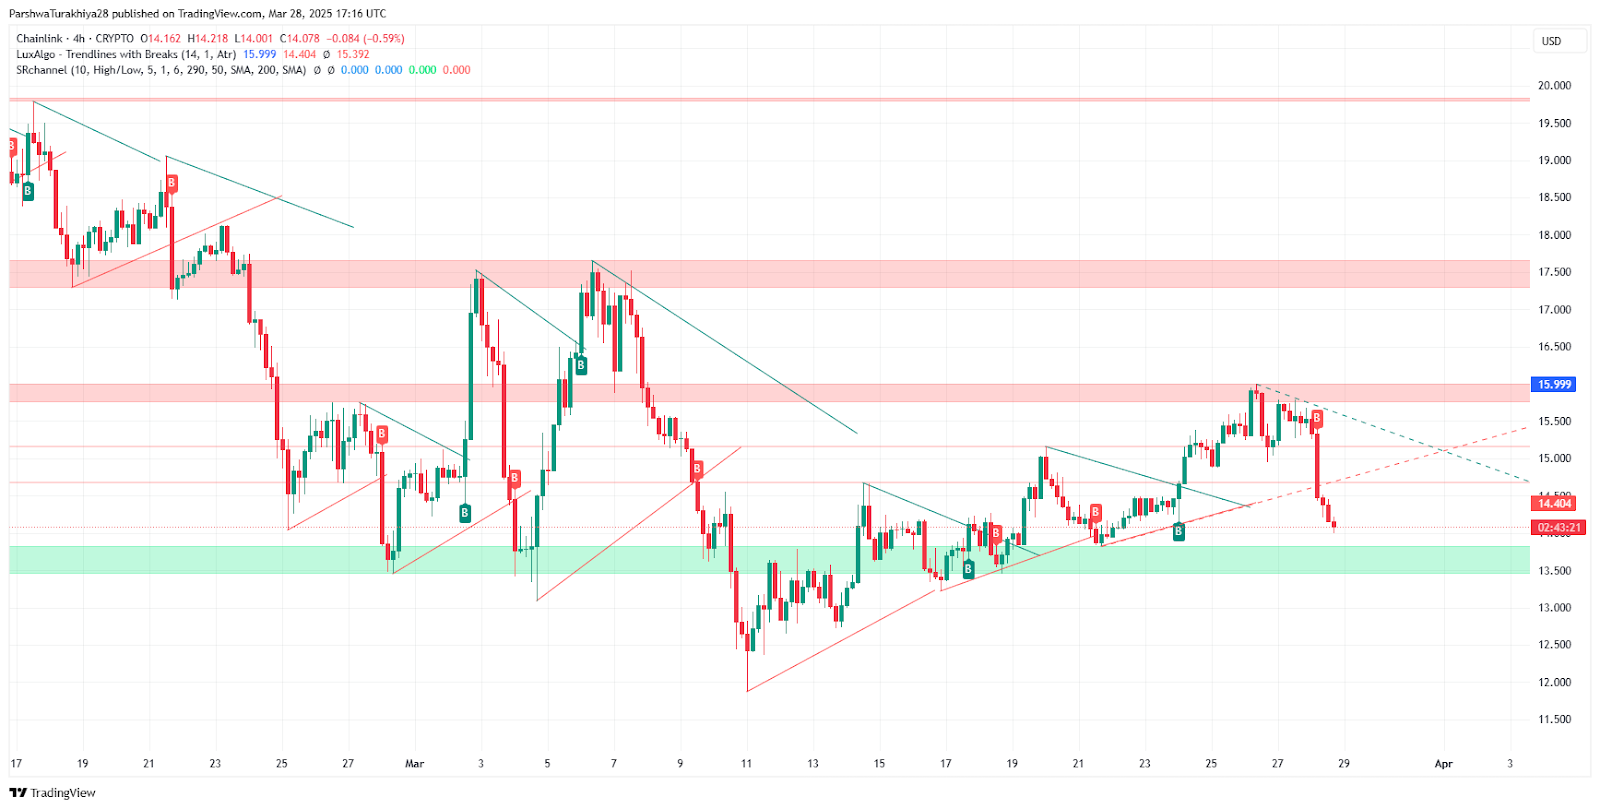
Chainlink (LINK) recently fell below a rising wedge pattern visible on its 4-hour chart, a formation that often signals bearish continuation. Following rejection near $15.99, the price now struggles to reclaim the $15 level.
LINK also trades below its major moving averages, with the 200-period Exponential Moving Average (EMA) around $15.35 acting as significant overhead resistance. A recent bearish crossover of the 20 EMA below the 50 EMA further underscores the weakening short-term trend.
While the Relative Strength Index (RSI) reads low near 33, potentially allowing for a relief bounce, no clear bullish divergence supports that outcome yet. Consequently, if LINK loses the key support area between $13.50–$13.80, analysis suggests a deeper correction toward $12.70 becomes more likely.
Hedera (HBAR): Testing Support as Momentum Weakens
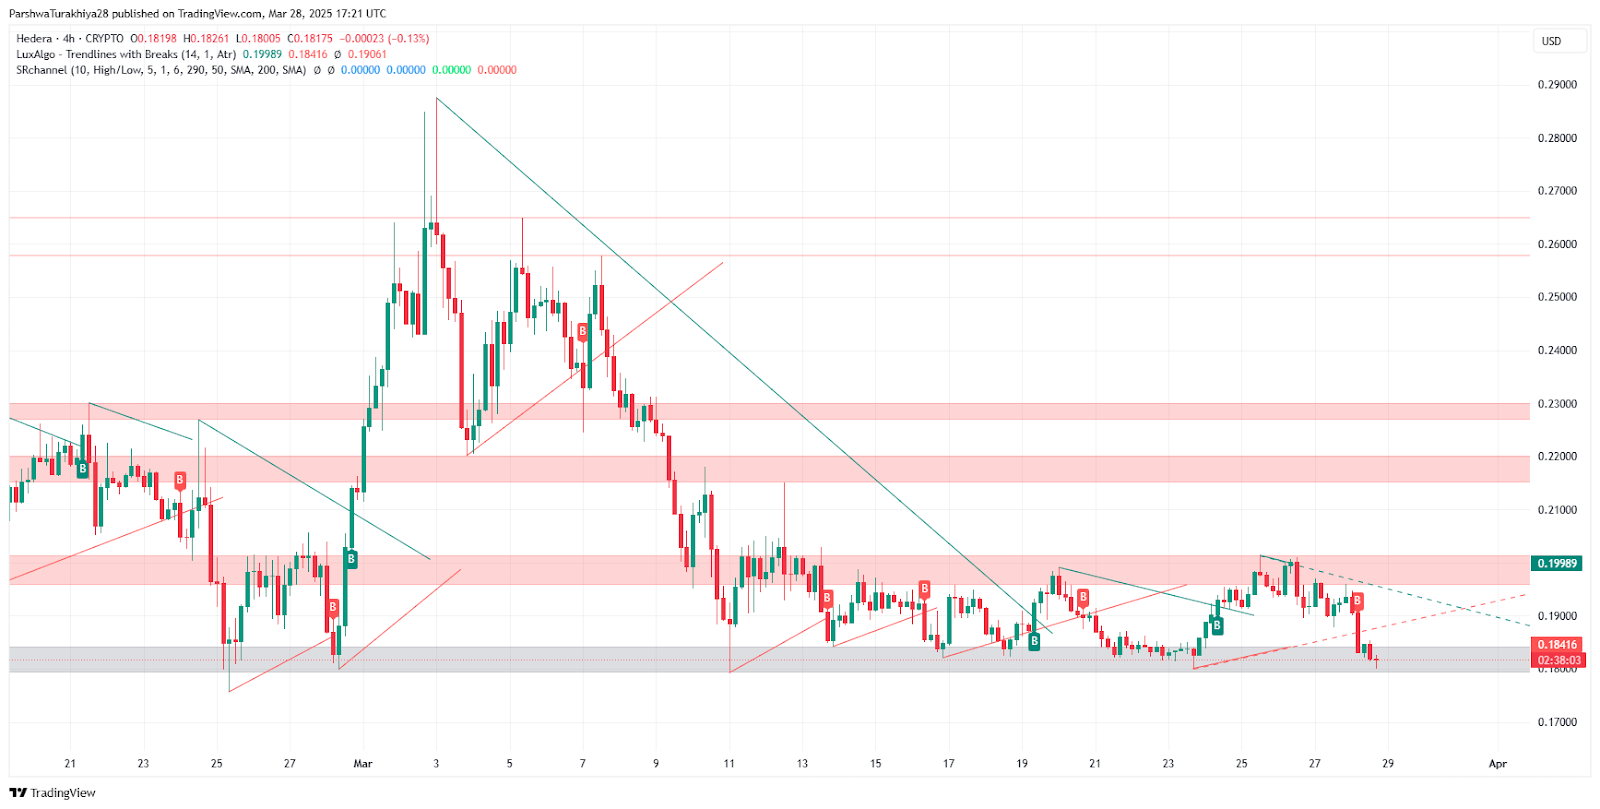
Hedera (HBAR) currently tests crucial support levels after facing repeated rejection near the $0.195–$0.20 resistance zone. Trading below major EMAs and having broken a recent ascending trendline, HBAR displays technical signs suggesting potential trend exhaustion. Its RSI has dipped to around 36, nearing traditionally oversold conditions.
Confirming this weakness, the Moving Average Convergence Divergence (MACD) indicator shows a bearish crossover with a negative histogram. Failure to hold the immediate $0.181 support could therefore lead HBAR down towards the $0.170–$0.175 range. A recovery requiring buyers to push price back above $0.195 is needed to re-establish a clear bullish footing
Telcoin (TEL): Slips Into Oversold Territory After Failed Breakout
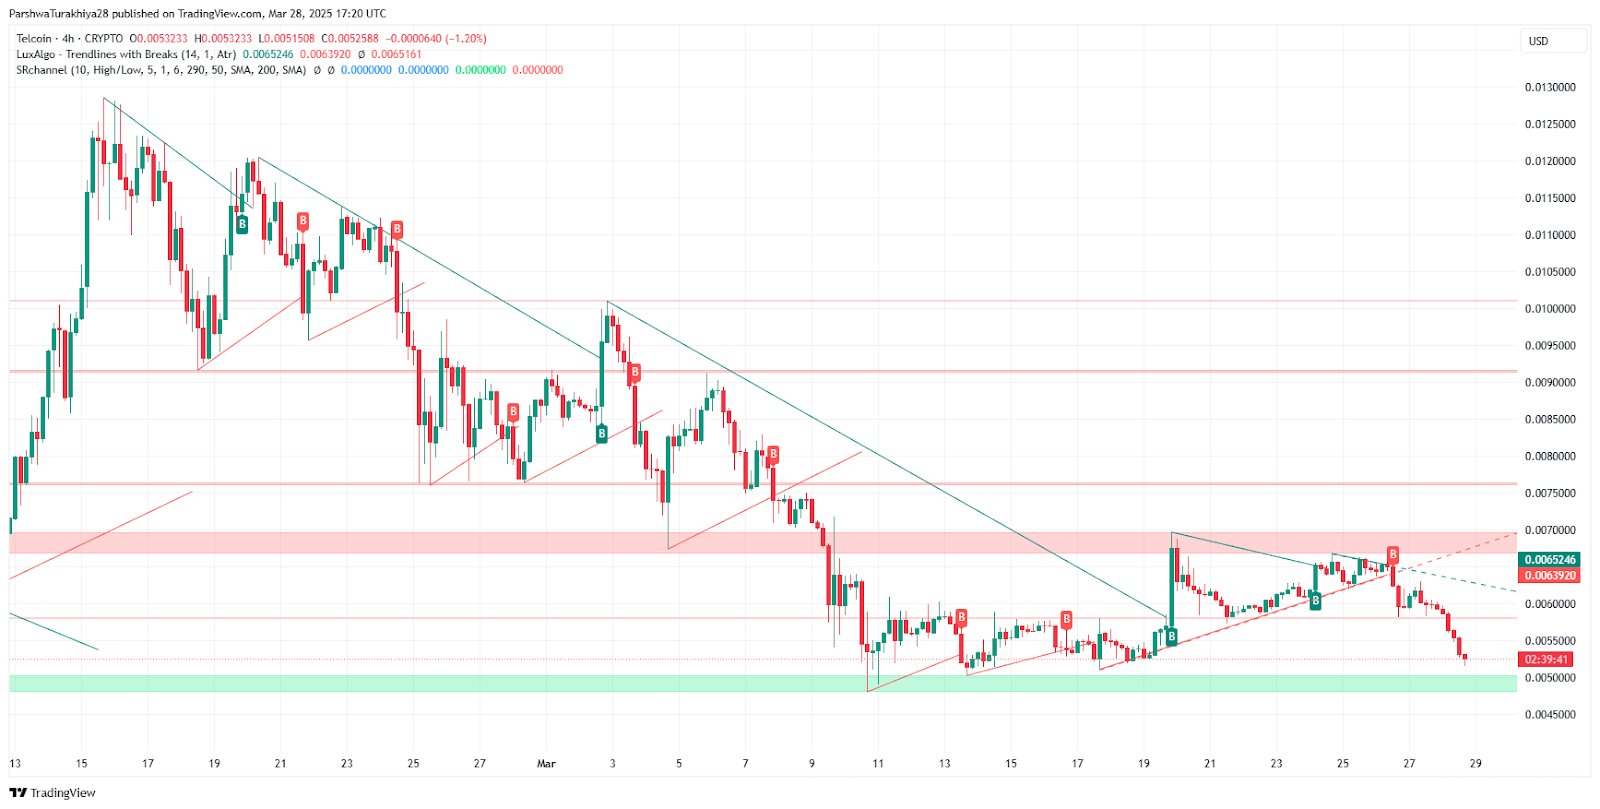
Telcoin (TEL) slipped into a critical demand zone identified between $0.0051–$0.0052 following a failed attempt to break out above resistance near $0.0063. The 4-hour RSI now shows a deeply oversold reading of 24. Although such extreme readings sometimes precede price bounces, this primarily confirms intense recent selling pressure. All key EMAs remain aligned bearishly above the price, reinforcing the negative trend.
The MACD indicator also supports this bearish short-term outlook. A sustained price close below the current $0.0051 demand zone could open the path towards lower supports near $0.0047–$0.0048. Bulls need to reclaim the $0.0056 level to challenge the immediate downtrend.
Celestia (TIA): Trendline Break Adds to Bearish Signals
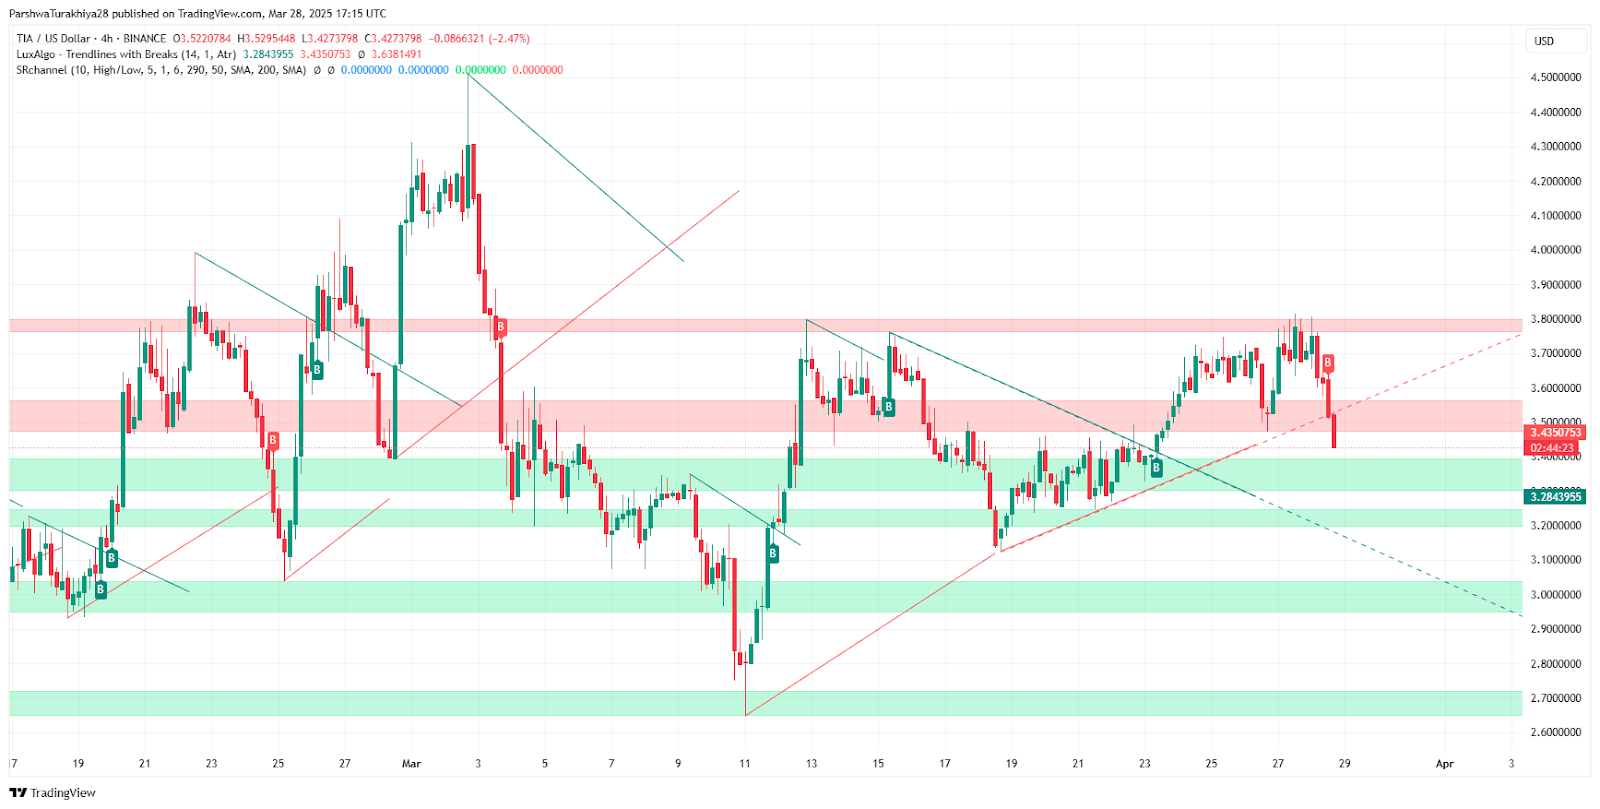
Celestia (TIA) recently broke below a key rising trendline that had acted as support. This breakdown occurred after the price failed to hold gains above the $3.80 resistance area. Trading near $3.44, TIA now approaches the lower edge of an important demand zone ($3.28–$3.30).
Its RSI reads just under 40 and continues to trend lower, possibly showing bearish divergence. Widening Bollinger Bands also point to increasing volatility. The MACD further reinforces the bearish sentiment. Unless TIA finds solid buying support within the current zone soon, further downside price action appears probable.
Related: What Does FDV Tell Us About 2024’s Top Altcoins — Winners vs. Losers
Outlook: Altcoins Test Support, Relief Bounce Possible?
These five altcoins all currently exhibit bearish technical pressure across multiple indicators. Each faces crucial tests of nearby support levels following recent price declines.
However, the deeply oversold RSI readings on some charts (like TEL and XRP) sometimes precede short-term relief rallies. Until key overhead resistance levels are convincingly reclaimed on increased trading volume, analysts generally advise caution regarding sustained bullish reversals.
The next few trading sessions therefore appear pivotal for determining whether these assets can stabilize or if they extend their current downtrends toward deeper support zones.
Disclaimer: The information presented in this article is for informational and educational purposes only. The article does not constitute financial advice or advice of any kind. Coin Edition is not responsible for any losses incurred as a result of the utilization of content, products, or services mentioned. Readers are advised to exercise caution before taking any action related to the company.
 Price Prediction 2025–2030: Will Privacy Coins Make a Comeback?")
 Price Prediction 2025–2030: Will It Break Past $1 in 2025?")
 Price Prediction 2025–2030: Can It Break Above $0.0002 in the Coming Bull Run?")
 Price Prediction 2025–2030: Will the Meme Coin Sustain Its Rally?")
 Price Prediction 2025–2030: Will FORM Rally After Its Breakout?")