

- One trader turned $85 into $2.3M after buying CASHCAT on June 18, three weeks before the rally peaked.
- Open interest surged 355.07% to $5.48M as volume jumped 262.74% to $16.74M.
- CASHCAT is holding inside an ascending channel after briefly spiking above the upper trendline.
Cash Cat trades at $0.1964 on July 11, up 0.20%, consolidating inside a steep ascending channel after a parabolic run that produced some of the most extreme return stories in recent meme coin history.
Is CASHCAT Still Inside Its Ascending Channel?
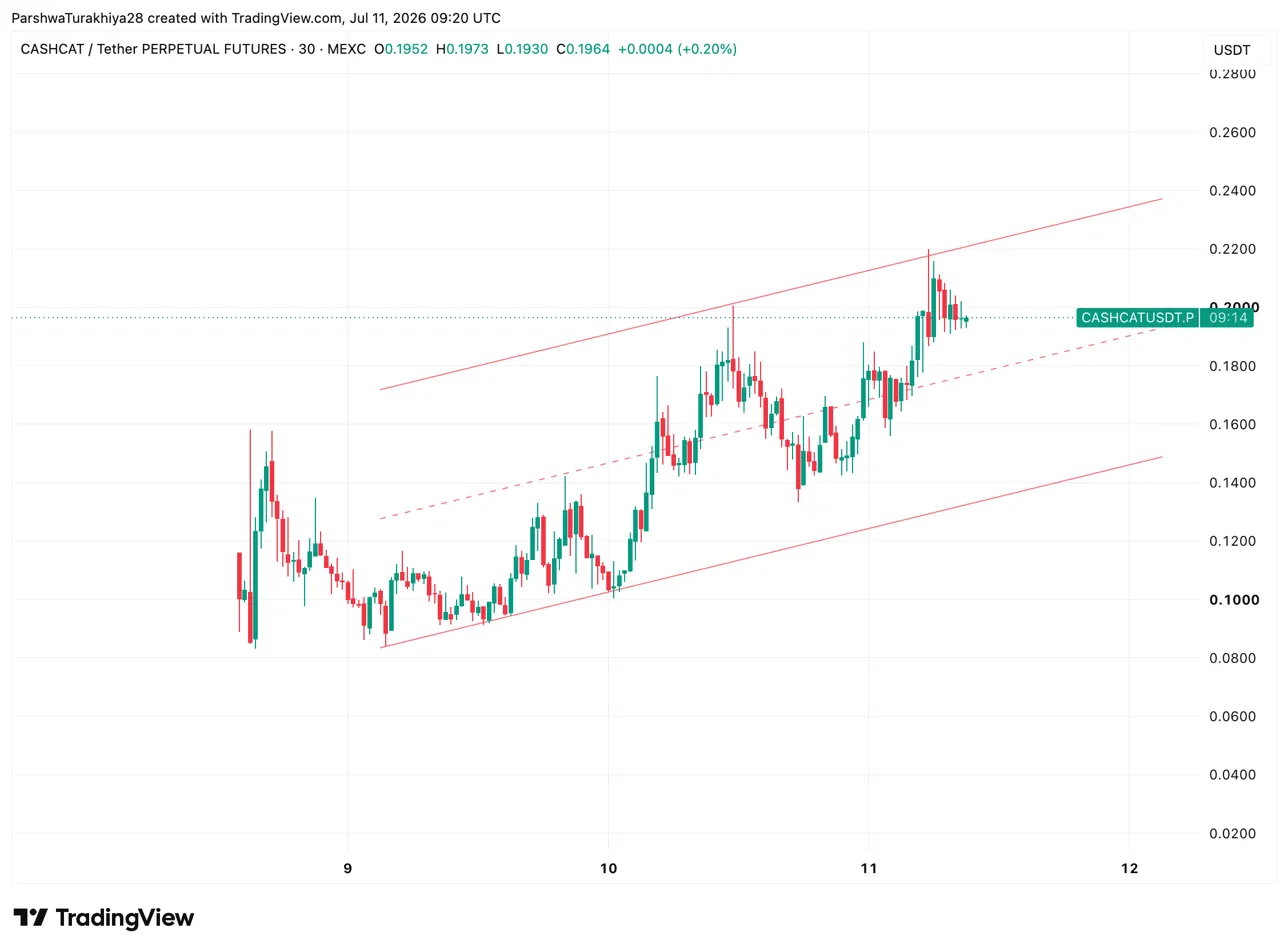
The 30-minute chart shows CASHCAT inside a steep ascending channel since July 9, with a brief spike above the upper boundary on July 11 reaching $0.2200 before pulling back. Price is now consolidating near $0.1964 with the channel floor rising toward $0.1600 as the level to hold.
What Are The Key Support And Resistance Levels For CASHCAT Today?
- Support at the channel lower trendline near $0.1600 and the $0.1930 intraday low
- Resistance at the upper channel boundary near $0.2200 and the spike high at $0.2200
Why Is CASHCAT’s Open Interest Up 355% In One Day?
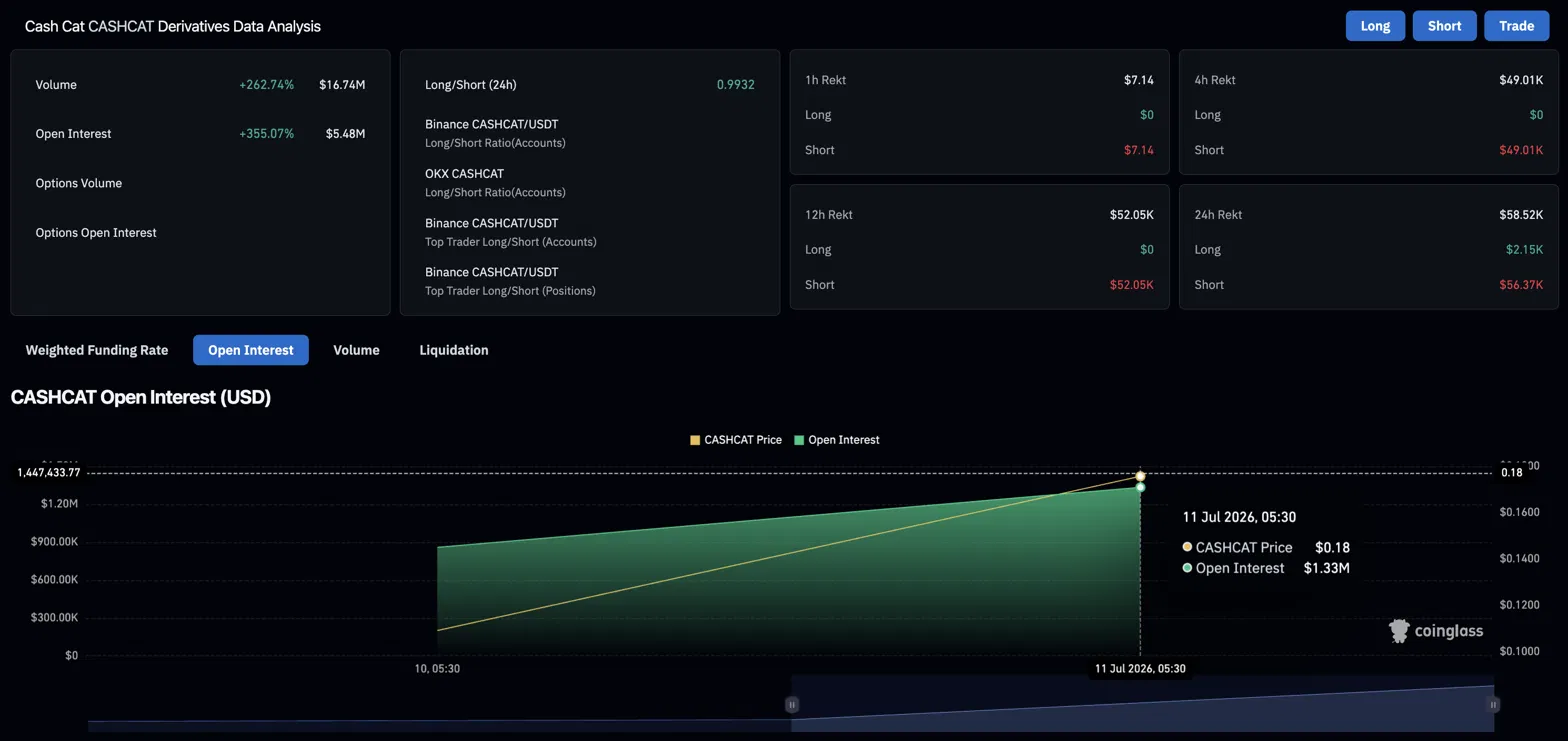
Derivatives volume jumped 262.74% to $16.74M while open interest surged 355.07% to $5.48M. Both rising sharply together means new leveraged money is flooding in rather than existing positions being recycled. The OI chart shows a near-vertical climb from July 10 to July 11; the entire derivatives market for CASHCAT was built in 48 hours.
Liquidations tell a one-sided story. Over 24 hours, $56.37K in shorts were wiped against just $2.15K for longs. Over 12 hours, $52.05K in shorts were liquidated against zero for longs. Every timeframe shows shorts getting punished with no long-side damage, meaning traders who bet against the rally are getting squeezed out at every level.
How an $85 CASHCAT Bet Turned Into $2.3 Million
Robinhood CEO Vlad Tenev posted on X that while Robinhood Chain is being built for real-world assets, “it works great for memes too.” That single comment redirected meme-coin traders’ attention toward Robinhood Chain’s meme-coin ecosystem, where CASHCAT had already emerged as the network’s most recognized token.
The price surge also brought attention to several early CASHCAT investors who generated massive returns. One trader spent $85 buying 17.4 million CASHCAT tokens on June 18, before the mainnet launch, and held through the run to a paper value of $2.3M at recent prices.
Another spent $838 and turned it into $1.05M. A third put in $86 and hit $1.6M. In each case, the tokens were bought during the early low-liquidity phase when CASHCAT was trading at fractions of a cent.
These stories have created their own momentum. Social media coverage of the wins pulled in a new wave of buyers, which is a defining characteristic of meme coin cycles and also what makes them difficult to time.
Related: Velvet Price Prediction: Velvet Price Jumps 30% as Bulls Eye $0.54 Breakout
CASHCAT Price Prediction: Upside and Downside Targets
- Upside case: The ascending channel holds, shorts continue to get squeezed, and CASHCAT retests the $0.2200 spike high on its way toward the upper channel boundary near $0.2400.
- Downside case: The channel floor near $0.1600 breaks under profit-taking from early holders, and CASHCAT retraces sharply as the meme coin narrative rotates to the next new token on Robinhood Chain.
Disclaimer: The information presented in this article is for informational and educational purposes only. The article does not constitute financial advice or advice of any kind. Coin Edition is not responsible for any losses incurred as a result of the utilization of content, products, or services mentioned. Readers are advised to exercise caution before taking any action related to the company.