

- BTC trades at $65,239 on August 10, consolidating above its cup and handle breakout with a $73K measured move target
- Analyst Ash Crypto argued the CLARITY Act delay mirrors the BlackRock ETF playbook, with institutions accumulating before regulation unlocks trillions
- Saylor hinted at a Bitcoin buying return on X with “Doing ₿usiness” after weeks of no Strategy purchases
The Bitcoin price prediction now hinges on two catalysts building at once: a CLARITY Act delay that analyst Ash Crypto says mirrors the BlackRock ETF playbook, and Michael Saylor’s hint that Strategy may start buying again.
BTC Price Analysis: Consolidating Above the Breakout, Waiting for a Catalyst
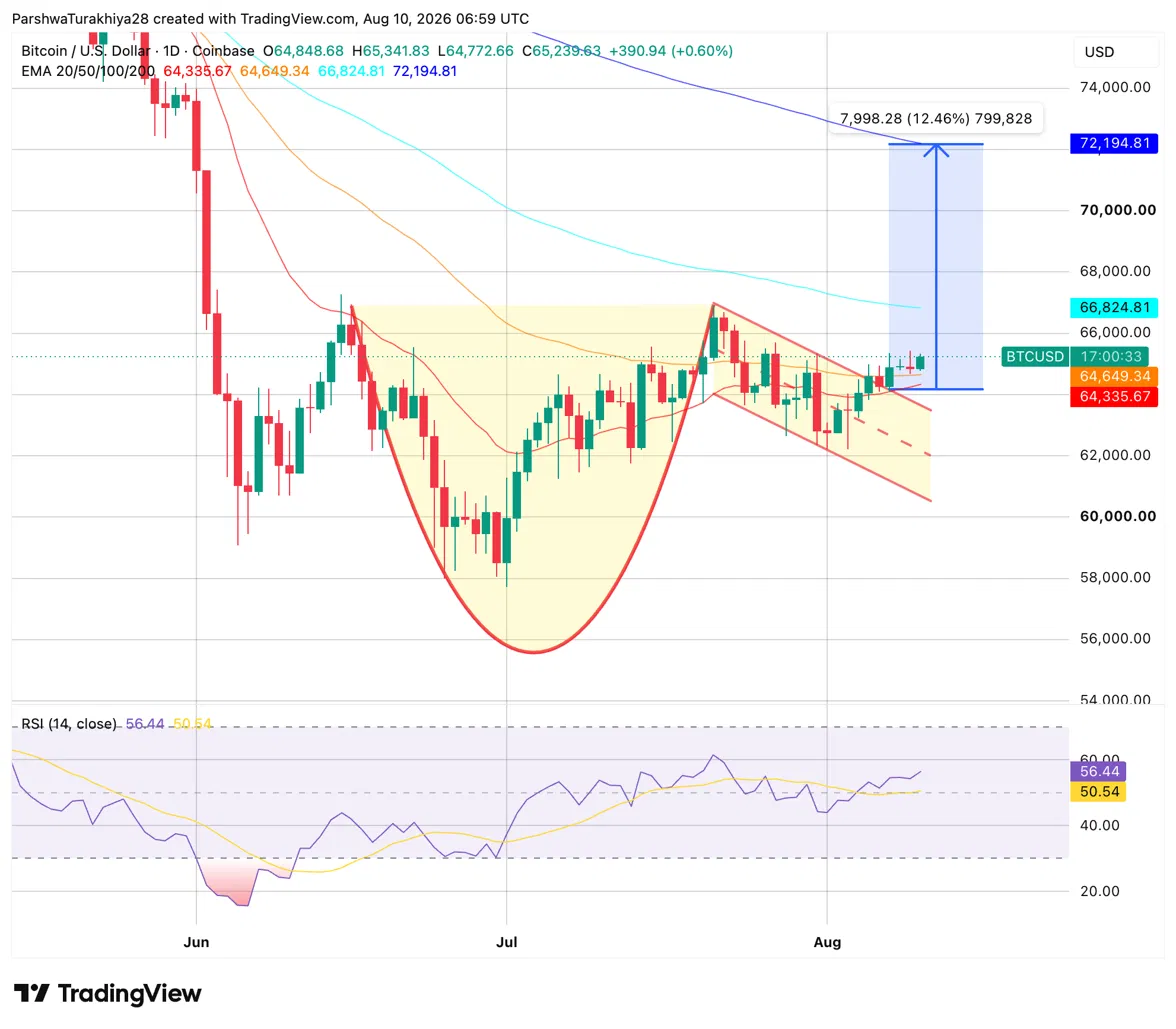
BTC has already broken above the cup and handle neckline near $65,000, completing a pattern that carved out from the June low near $55,000. The cup formed through June and early July, the handle compressed between $62,000 and $65,000 through late July, and the breakout is confirmed. What hasn’t arrived yet is the follow-through move. Price is consolidating in the $64,000 to $65,500 range just above the breakout zone, which is typically healthy post-breakout behavior that precedes the larger directional move.
Related: Pump.fun Price Prediction: Can PUMP Hold Its Breakout After Selling $807M in SOL?
The 20-day EMA at $64,336 and the 50-day at $64,649 both sit just below current price and form the first support levels on any pullback; holding above them keeps the breakout structure intact. The 100-day EMA at $66,825 is the next meaningful resistance, followed by the 200-day at $72,195, which aligns closely with the $73,000 measured move target, about 12.46% above the breakout zone. RSI at 56.44 sits above both the neutral line and its own signal at 50.54, confirming momentum hasn’t faded despite the pause.
BTC Support and Resistance Levels, August 10, 2026
| Type | Price | Level |
| Resistance | $66,825 | 100-day EMA, first major test above |
| Resistance | $72,195 | 200-day EMA, aligns with measured move |
| Resistance | $73,000 | Cup and handle measured move target |
| Support | $64,649 | 50-day EMA, key consolidation floor |
| Support | $64,336 | 20-day EMA |
| Support | $62,000 | Handle support, must hold |
| Support | $55,000 | Cup base, last major floor |
BTC Derivatives: Shorts Getting Squeezed as Options Activity Spikes
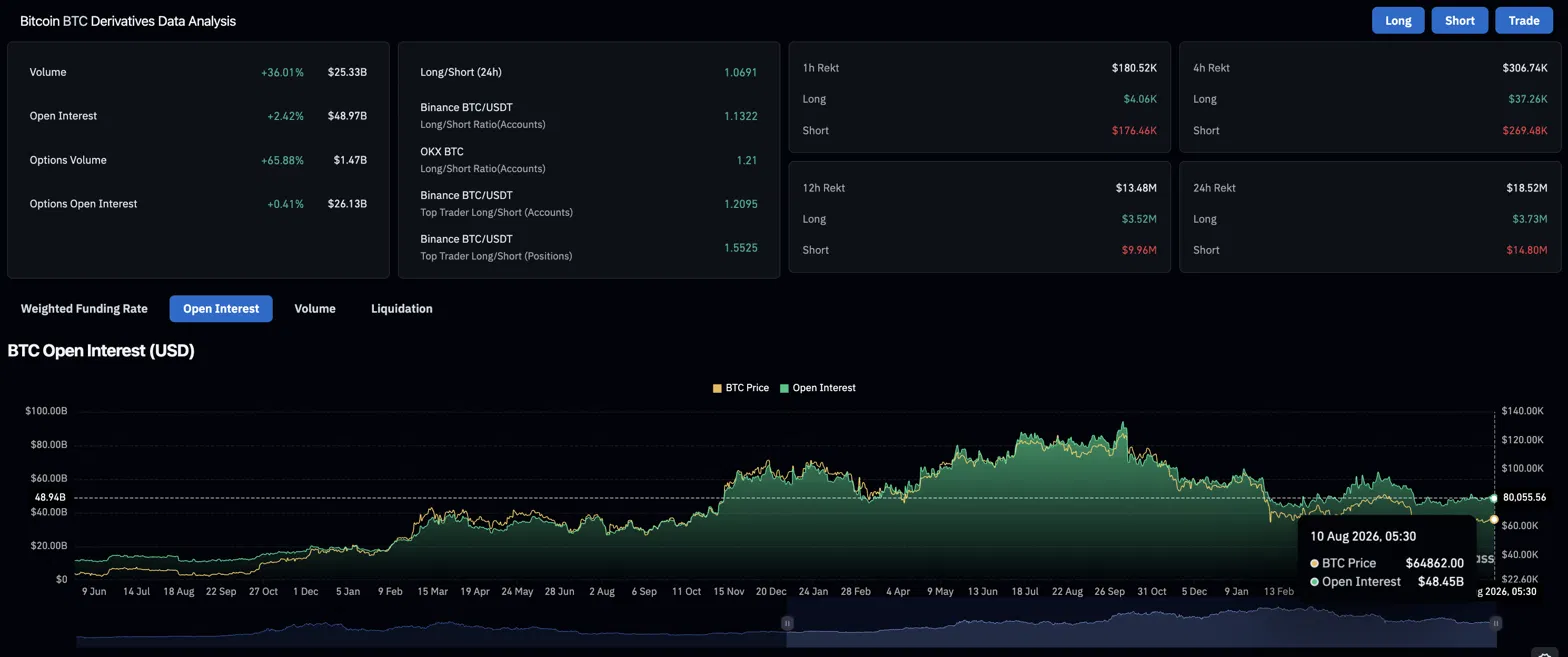
Volume rose 36.01% to $25.33B while open interest climbed 2.42% to $48.97B. Options volume surged 65.88% to $1.47B, suggesting traders are actively positioning around the consolidation zone rather than waiting on the sidelines.
Top trader position sizing at 1.5525 is firmly net long, and liquidations over 24 hours totaled $18.52M with shorts absorbing $14.80M against just $3.73M for longs. That four-to-one ratio in favor of shorts getting squeezed is consistent with price holding above the breakout zone and keeping downside bets under pressure.
| Metric | Value | Interpretation |
| 24h Volume | $25.33B (+36.01%) | Rising activity around the consolidation |
| Open Interest | $48.97B (+2.42%) | Fresh positioning being added |
| Options Volume | $1.47B (+65.88%) | Active hedging at the breakout level |
| Top Trader L/S (Positions) | 1.5525 | Large accounts firmly net long |
| 24h Liquidations | $18.52M | Shorts absorbed nearly 80% of the pain |
BTC Analysis: Is the CLARITY Delay Letting Institutions Load Up?
Analyst Ash Crypto posted a comparison on X that reframes the CLARITY Act delay entirely, mapping the current situation against the BlackRock Spot ETF playbook from 2022 to 2024. BlackRock launched a private Bitcoin trust in 2022 while retail was selling, filed for the Spot ETF when most had given up, and by the time approval came, Bitcoin had already run from $38,700 toward $126,000. Retail bought after the news, not before.
Ash Crypto’s read is that the CLARITY Act’s repeated delays may follow the same pattern. If regulation is inevitable and institutions know it, a delay simply gives them more time to accumulate at lower prices before trillions in regulated capital can legally enter the market. The chart he shared annotates the full cycle from 2021 to now, marking the current moment against the equivalent point just before the ETF approval, when the same retail skepticism and institutional quiet accumulation played out.
Meanwhile, Michael Saylor hinted on X at a possible return to Bitcoin buying for Strategy, posting “Doing ₿usiness” after weeks of no purchases. If Strategy resumes buying, it adds a corporate treasury demand layer to what is already a technically constructive consolidation above the breakout zone.
BTC News: Concentration at 14.8% Signals Volatility Is Building
Independent analyst Murphy flagged on August 10 that Bitcoin’s concentration metric has risen to 14.8%, approaching what he calls the high-risk zone. The read is not directional: rising concentration signals volatility is building rather than pointing to an immediate move up or down.
Related: Bubblemaps Price Prediction: BMT Surges 228% as Open Interest Hits $15 Million
Murphy’s historical analysis shows that when concentration trends upward from a prior uptrend, upside odds are higher. With BTC recovering from June lows and holding above a confirmed breakout, the prior trend context leans bullish, making this a volatility warning to watch rather than a reason to exit.
BTC Price Prediction: Upside and Downside Targets
Bullish Case, Target: $73,000 (Measured Move)
BTC holds the consolidation zone above $64,500 and the 50-day EMA on any pullback, confirming the post-breakout base is building rather than failing. The CLARITY Act institutional accumulation thesis draws fresh buying, Saylor’s return adds corporate demand, and short liquidations accelerate the move through the 100-day EMA at $66,825 toward the 200-day at $72,195 and the $73,000 measured move target.
Bearish Case, Risk Level: $62,000 (Handle Support)
The consolidation breaks lower and BTC loses the 50-day EMA at $64,649 on a daily close, turning the post-breakout base into a failed structure. Concentration rising to 14.8% triggers a volatility spike to the downside and the handle support at $62,000 becomes the next meaningful test, with the cup base near $55,000 as the deeper floor if that level gives way.
Disclaimer: The information presented in this article is for informational and educational purposes only. The article does not constitute financial advice or advice of any kind. Coin Edition is not responsible for any losses incurred as a result of the utilization of content, products, or services mentioned. Readers are advised to exercise caution before taking any action related to the company.