


- A famous analyst predicts a big move for BTC.
- Bears gain control of both the four hour and twenty four hour price chart.
- Indicators show that the bearish trend will not last.
A crypto netizen and analyst, @AltcoinSherpa took to Twitter to share his insights about BTC. In his tweet, he mentioned that BTC had the potential to hit 17K before the beginning of 2023.
The price of Bitcoin (BTC) is down 0.19% in the last 24 hours. At presstime, BTC is trading at $16,840.89. The slight price decrease has caused BTC’s market cap to decrease slightly to $323,987,731,307. The decrease of market cap to $149,695,046,047 is showing volatility in BTC.
According to a tweet from an analyst, BTC is optimistic to reach $17,075.14 by the end of 2022. This move will set a new bullish pace for BTC.
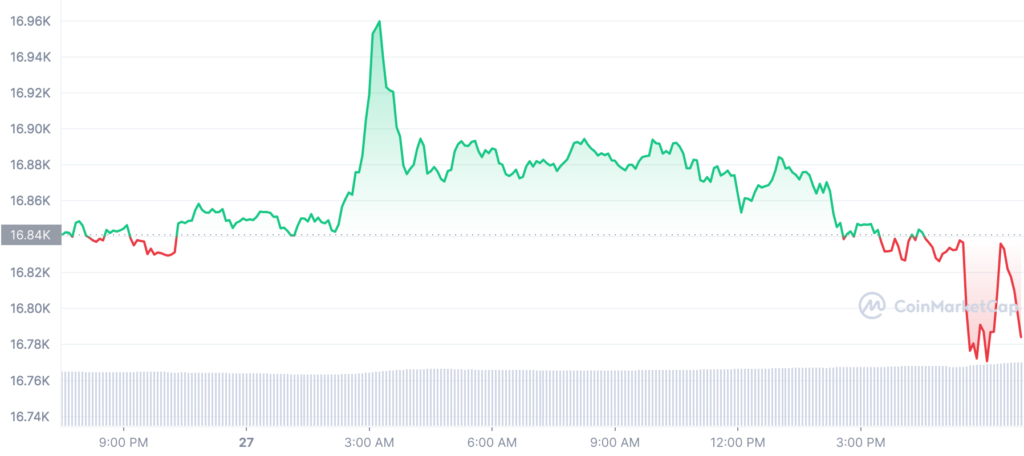
Following a return of the bearish momentum, the price of bitcoin plummeted once more to $16,788, indicating a bullish bias in the cryptocurrency today. BTC began to retrace lower earlier last week, and the bears have been in control for the previous few hours due to a minor but consistent decline in price levels. However, the trend changed today in favour of purchasers, and during the past several hours, the price has dramatically dropped to $16,840.89.
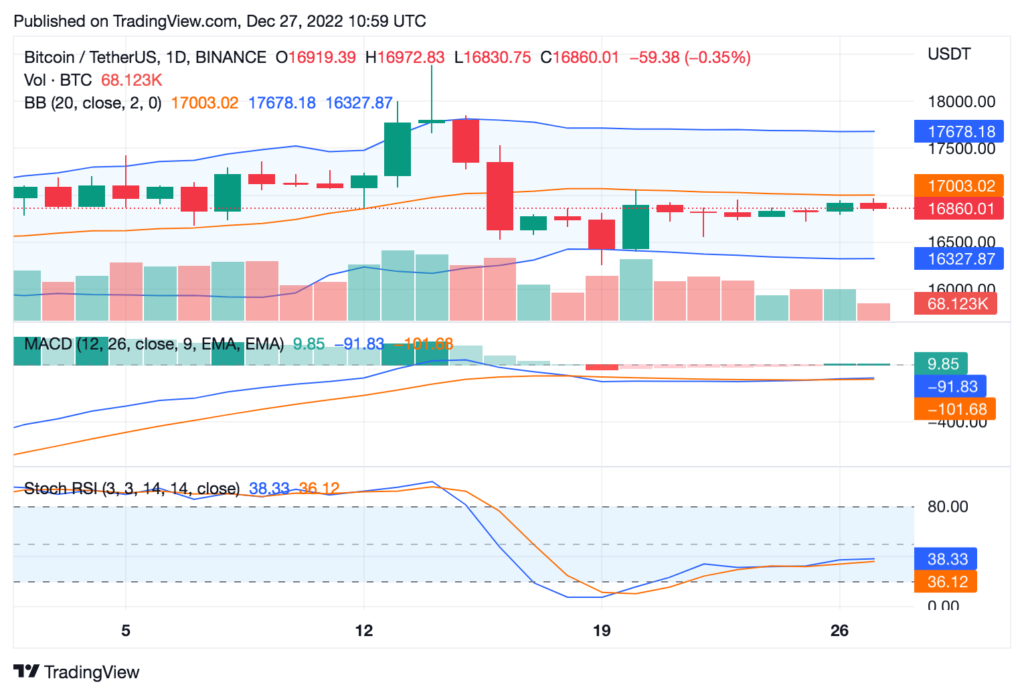
As long as the Moving Average Convergence Divergence (MACD) line remains above the signal line, there may be a short term bearish sentiment in the BTC market in the ensuing hours. Therefore, before entering the Bitcoin market, traders and investors should act with great prudence. The development of a negative trajectory histogram indicates that this bearish strength may last for some time in the BTC market.
The market’s current bearish trend may persist, according to the Stochastic Relative Strength Index (SRSI) line, which is currently at 38.33. Due to the latest decline below its SMA line, which is extending the currently negative trend, investors are concerned about the probability of a bearish persistence.
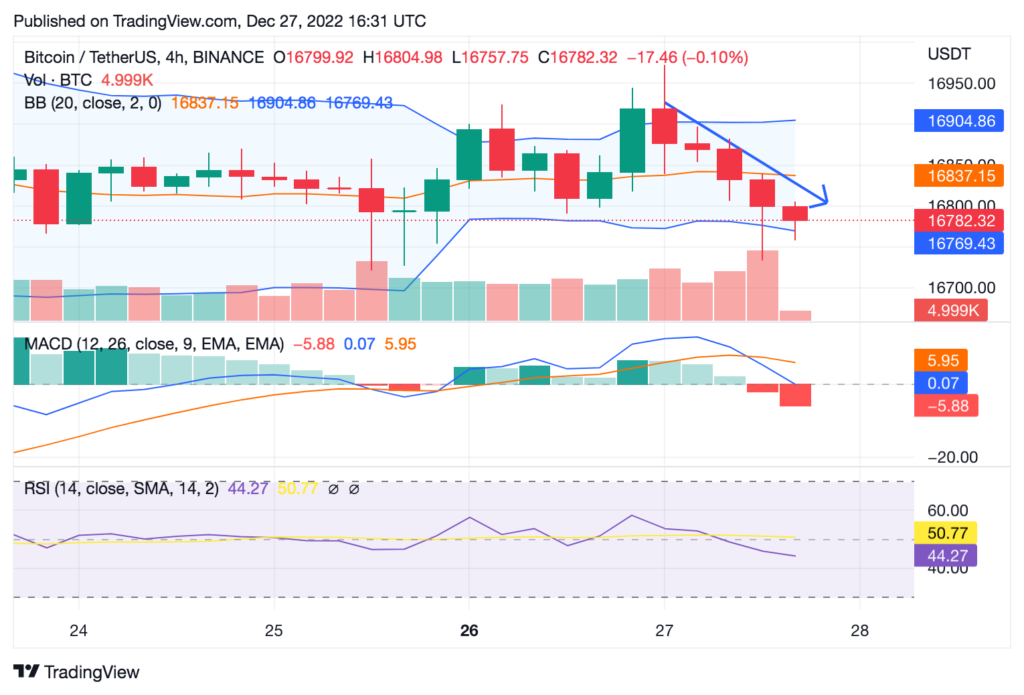
On the 4 hour chart, the bears have fully taken control of Bitcoin’s market. For the past four hours BTC has been on a prolonged decline driving the prices near the support level at $16,794.
The converging Bollinger Band (BB) indicates that the current mood on the BTC market is bearish. On the lower band, the lowest point that can be achieved is $16,766, while the maximum point that can be reached on the upper band is $16,900
Disclaimer: The views and opinions, as well as all the information shared in this price prediction, are published in good faith. Readers must do their research and due diligence. Any action taken by the reader is strictly at their own risk. Coin Edition and its affiliates will not be held liable for any direct or indirect damage or loss.
Disclaimer: The information presented in this article is for informational and educational purposes only. The article does not constitute financial advice or advice of any kind. Coin Edition is not responsible for any losses incurred as a result of the utilization of content, products, or services mentioned. Readers are advised to exercise caution before taking any action related to the company.


 Price Prediction 2026, 2027, 2028, 2029, 2030-2050")

