


- Dan Gambardello tweeted that Cardano’s beginning is similar to that of Amazon’s formation years.
- Meanwhile, an analyst from Cheeky Crypto predicted that ADA’s price may continue to drop in the coming weeks.
- At press time, a symmetrical triangle chart pattern was present on ADA’s daily chart.
A tweet by the cryptocurrency analyst and trader Dan Gambardello published earlier today has drawn intriguing parallels between Cardano’s early stages and the formative years of the e-commerce giant Amazon. While the differences between the two are stark, there are valuable lessons ADA holders can glean from Amazon’s past, noted the analyst.
In his tweet, Gambardello revealed that ADA holders have weathered a challenging bear market, reminiscent of Amazon’s own roller coaster ride in the early 2000s. Though the technologies and goals of Cardano and Amazon differ significantly, their historical price patterns bear uncanny similarities.
During Amazon’s tumultuous crash, CEO Jeff Bezos delivered a resounding message to shareholders – one that holds relevance for ADA holders, according to the analyst. Despite the steep decline in Amazon’s stock price, Bezos emphasized that the company was stronger than ever before.
Gambardello believes that this principle rings true for Cardano as well. Amid market fluctuations, Cardano’s commitment to technological advancement and development places it in an advantageous position for future growth and adoption.
Amazon’s meteoric rise to success was fueled by its dedication to innovation and relentless improvements in customer experience, added Gambardello. Similarly, Cardano’s continuous upgrades and ecosystem development are laying the groundwork for its own journey toward widespread adoption.
The analyst also suggested that ADA holders should embrace the notion that market sentiment acts as a “voting machine” in the short term, while long-term success is determined by the “weighing machine” of fundamental value. He concluded the post by stating that Amazon’s history teaches us that setbacks can often pave the way for remarkable comebacks.
In related news, an analyst from the analysis and trading channel Cheeky Crypto predicted that ADA’s price may continue to drop in the coming few weeks. His prediction was based on an Elliott Wave analysis that he had performed on the altcoin’s weekly chart. This analysis revealed that ADA’s price was still in a corrective wave.
In his video, he also shared some significant statistics for the altcoin. Most notably, the number of addresses holding ADA stood at just over 4.4 million. However, only 35,456 of these on-chain addresses are currently active.
Furthermore, the collective Dollar total of ADA liquidations over the past 24 hours was estimated to be $164,443. Interestingly, short positions accounted for more than half of the total ADA-related liquidations during this period, with 69.37% of liquidations being executed on people betting against the cryptocurrency.
Meanwhile, at press time, CoinMarketCap indicated that the Ethereum-killer was changing hands at $0.2565. This was after ADA’s price slipped 0.37% throughout the past 24 hours. Moreover, the latest price drop dragged the altcoin’s weekly performance further into the negatives to -2.59%.
ADA was not the worst performing altcoin in the top 10 list, however, as its competitor Solana (SOL) printed the biggest loss during this period. At press time, the cryptocurrency market tracking website indicated that SOL’s price had dropped more than 2% during the past 24 hours – bringing its price down to $19.34 as a result.
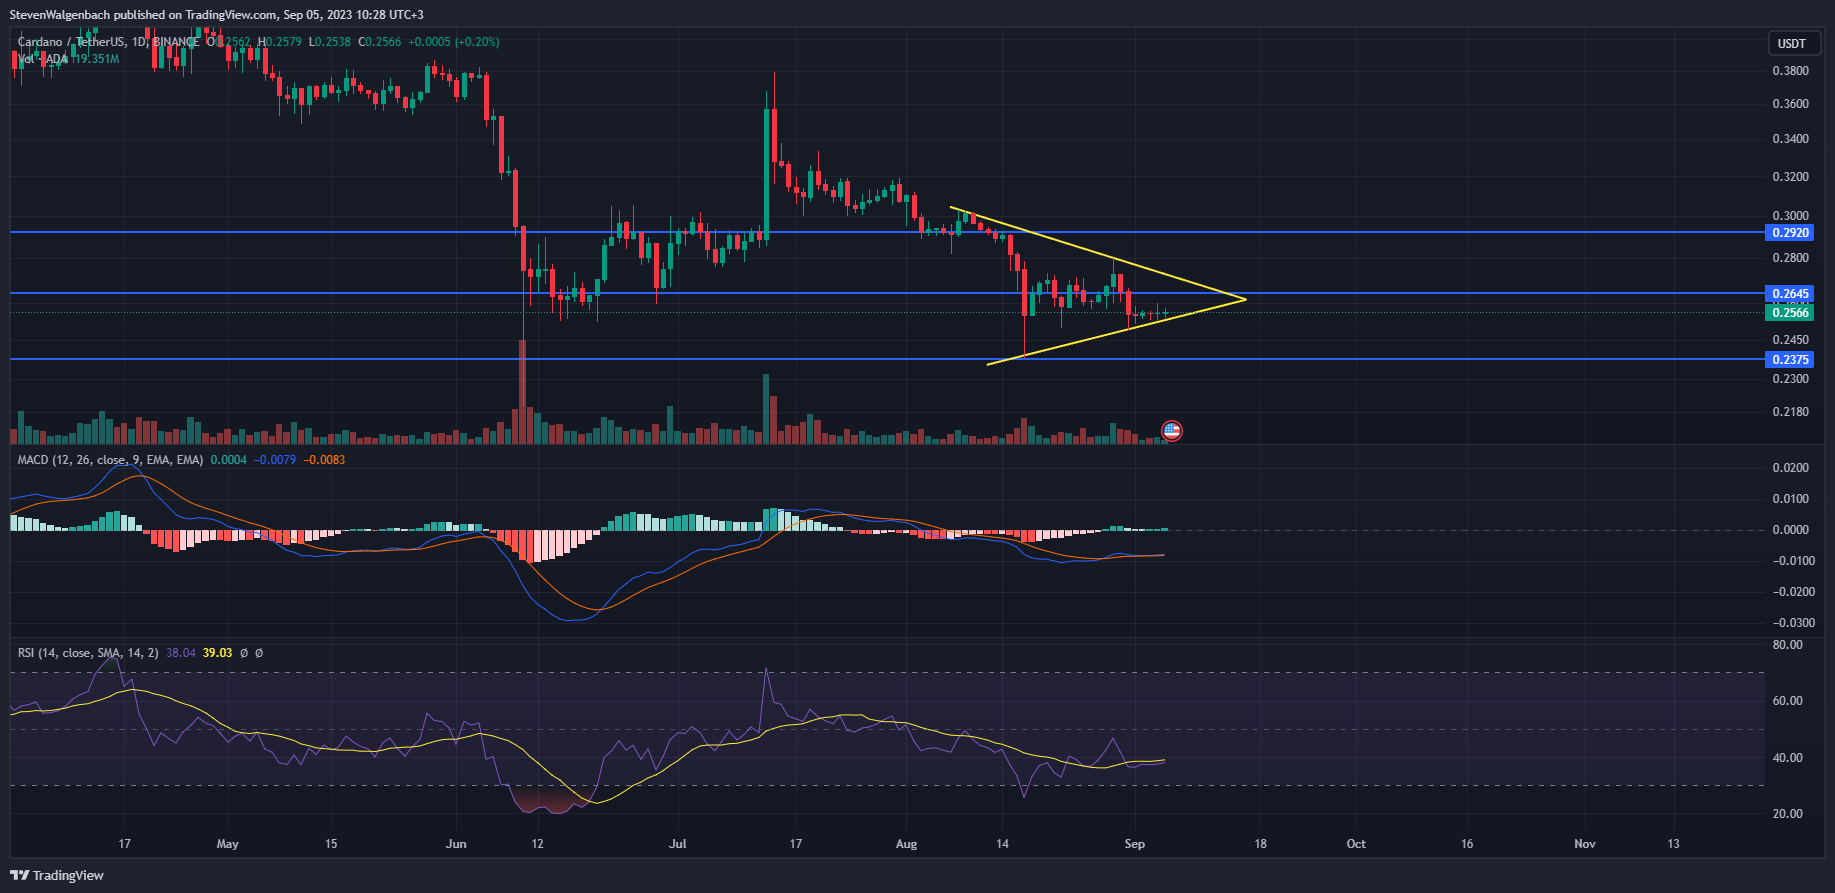
From a technical perspective, a symmetrical triangle pattern had formed on ADA’s daily chart, which suggested that the cryptocurrency’s price may break out soon. Furthermore, the MACD and RSI indicators indicated that this potential breakout could propel ADA’s price either way.
If ADA’s price breaks out towards the down side, then it may attempt to retest the $0.2375 support level in the coming few days. Conversely, a positive breakout may result in the altcoin’s price soaring to as high as $0.2920 within the following week.
A confirmation of this bullish breakout will be when ADA closes a daily candle above $0.2645. On the other hand, the altcoin will be at risk of its price dropping to the aforementioned $0.2375 support if it breaks below the lower level of the triangle chart pattern over the next 48 hours.
Disclaimer: The views and opinions, as well as all the information shared in this price analysis, are published in good faith. Readers must do their own research and due diligence. Any action taken by the reader is strictly at their own risk. Coin Edition and its affiliates will not be held liable for any direct or indirect damage or loss.
Disclaimer: The information presented in this article is for informational and educational purposes only. The article does not constitute financial advice or advice of any kind. Coin Edition is not responsible for any losses incurred as a result of the utilization of content, products, or services mentioned. Readers are advised to exercise caution before taking any action related to the company.


