


- Dan Gambardello shared in an X post yesterday that ADA could realistically reach $11.
- At press time, ADA’s price was down 1.24% and stood at $0.5599.
- Short-term technical indicators for ADA suggest it may correct to $0.45 in the coming couple of days.
The popular cryptocurrency trader and analyst Dan Gambardello shared in an X (formerly Twitter) post yesterday that Cardano (ADA) could reach $11. In the post, he added that this price target is “a very realistic figure.”
Although the analyst has a positive outlook towards ADA, the cryptocurrency’s price has dropped over the past 24 hours. Data from the cryptocurrency market tracking website CoinMarketCap indicated that ADA was down 1.24% and was changing hands at $0.5599 at press time. Looking at the longer timeframes, ADA was still up more than 32% over the past 7 days.
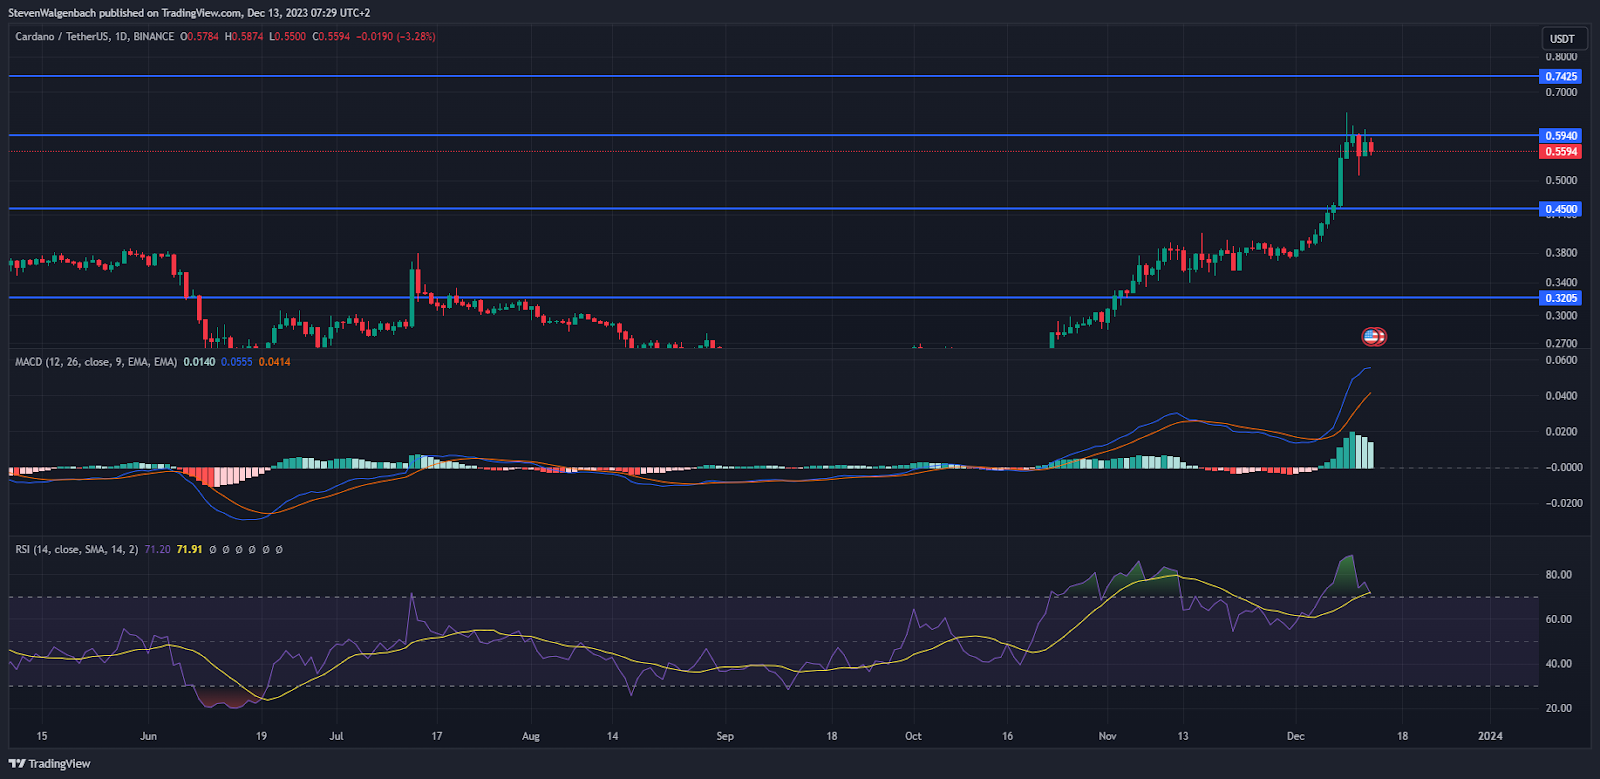
ADA was challenging the strong barrier at $0.5940 at press time. Should it close a daily candle above this resistance level within the next 48 hours, it may have a clear path to rise to $0.7425 in the coming week. Conversely, ADA failing to close a daily candle above $0.5940 within the next two days could put the altcoin at risk of a strong correction.
In this bearish scenario, ADA could fall to the $0.45 support level. Continued sell pressure may then drag ADA below this point to $0.3205 through the course of the following two weeks.
Technical indicators on ADA’s daily chart suggested that the cryptocurrency’s price may pull back in the next few days. Both the Moving Average Convergence Divergence (MAD) and the Relative Strength Index (RSI) indicators showed diminishing buying pressure for ADA.
In the last 24 hours, the RSI line broke below the RSI Simple Moving Average (SMA) line. This is a significant bearish technical flag and indicates that sellers have gained an upper hand against buyers on ADA’s chart. The slope of the MACD histogram was also negative, which could be an early indication of a bearish trend reversal for ADA.
Disclaimer: The information presented in this article is for informational and educational purposes only. The article does not constitute financial advice or advice of any kind. Coin Edition is not responsible for any losses incurred as a result of the utilization of content, products, or services mentioned. Readers are advised to exercise caution before taking any action related to the company.


