
- HYPE eyes $60 as buyers challenge the 200 EMA resistance near $58.
- Elevated Bollinger readings suggest HYPE could face a short-term pullback.
- Rising spot inflows and treasury demand strengthen HYPE’s broader outlook.
Hyperliquid’s HYPE token has regained momentum as buyers push the price toward a critical technical barrier. HYPE trades near $57.21 after gaining 4.55% over the past 24 hours. The token also holds a 1.56% gain over the past seven days.
Trading volume has reached nearly $294 million, showing strong market participation. Its circulating supply stands near 220 million HYPE, giving the token a market value above $12.7 billion. However, the latest recovery faces an important test near the 200 EMA. A decisive move above that level could strengthen bullish sentiment and improve the outlook toward $60.
HYPE Approaches a Major Breakout Zone
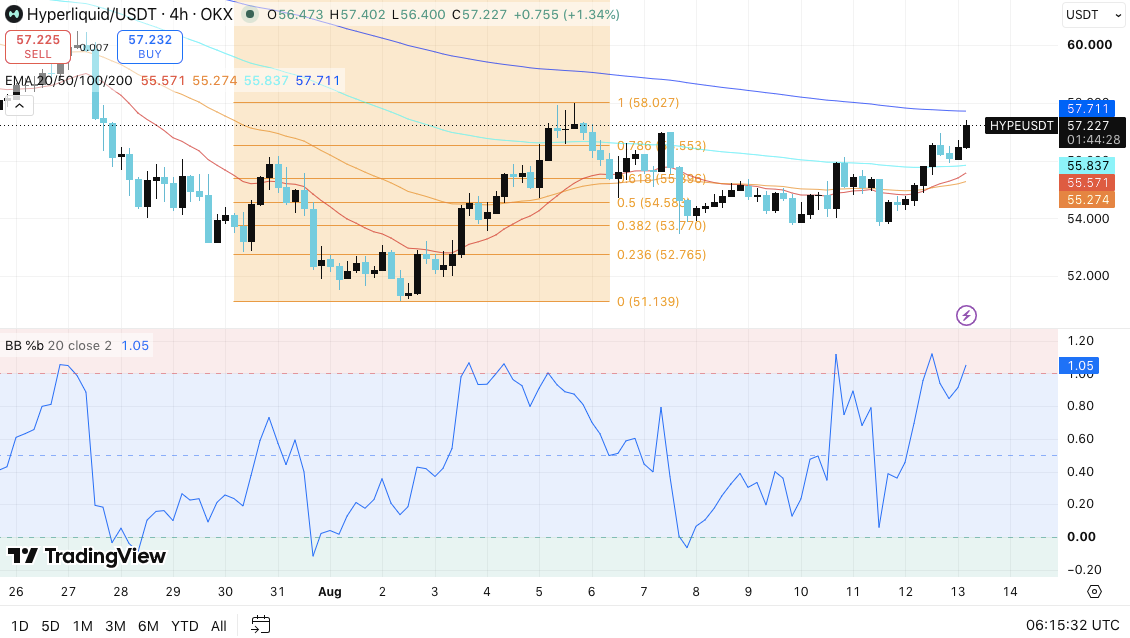
HYPE recently recovered from the $54–$55 region and reclaimed several important moving averages. The token now trades above its 20, 50, and 100 EMAs on the four-hour chart. Consequently, short-term momentum currently favors buyers.
However, HYPE now faces resistance between $57.71 and $58.03. This zone includes the 200 EMA, which often influences broader trend direction. A sustained four-hour close above $58.03 could confirm a stronger bullish continuation.
Moreover, such a breakout could shift attention toward the psychological $60 level. Buyers would need to maintain volume and follow-through to sustain that move.
The Bollinger Band %b currently stands at 1.05, placing HYPE above the upper band. This reading highlights strong momentum but also signals elevated short-term conditions. Hence, traders could see a temporary pullback before another attempt at resistance.
Support Levels Could Define the Next Move
A healthy retracement could bring HYPE toward $55.84, where the 100 EMA provides initial support. Below that level, the $55.57–$55.27 region contains the 20 and 50 EMAs.
Significantly, buyers need to defend $55.27 to preserve the current bullish structure. A break below that level could increase selling pressure and expose $54.58. Additional downside levels sit at $53.77 and $52.77.
Meanwhile, $51.14 represents deeper support if sellers regain control. Therefore, the reaction around $55.27 could offer an important signal about market strength.
Open Interest Shows Cautious Positioning
HYPE’s derivatives market continues to show substantial trader activity despite recent fluctuations. Open interest climbed from roughly $1.5 billion in May to above $3.5 billion in early June.
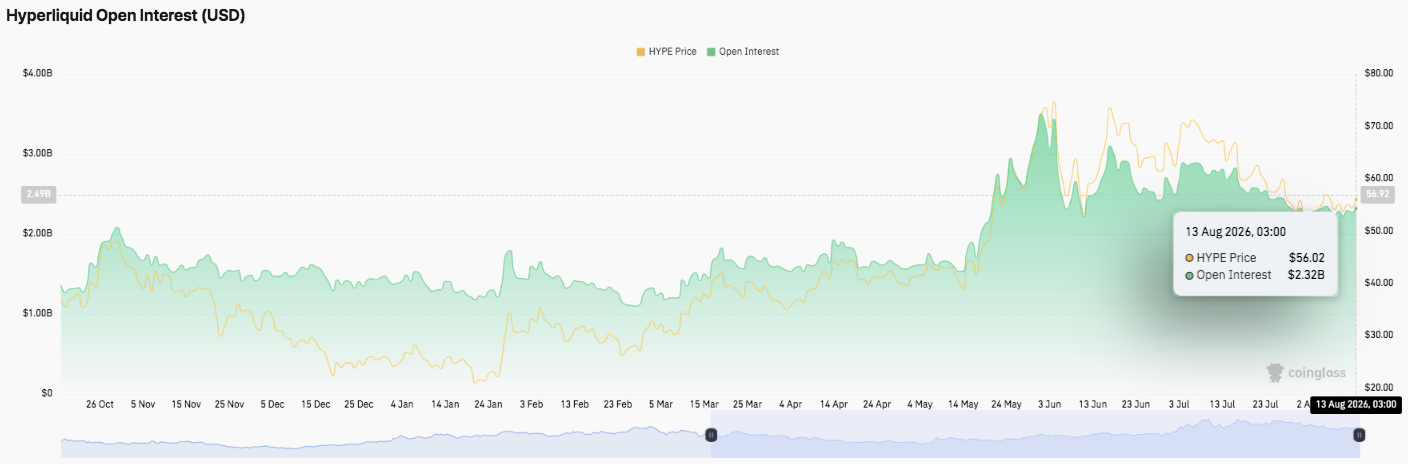
However, open interest later declined and moved within a broader $2.3 billion–$3 billion range. The latest reading sits near $2.32 billion, suggesting traders still maintain meaningful exposure.
Additionally, the decline from June’s peak indicates that speculative positioning has cooled. A recovery above $2.5 billion could support a stronger price advance. Conversely, another decline could signal continued deleveraging.
Spot Flows and Treasury Demand Add Support
Spot flows have remained uneven, with outflows dominating several periods during the broader decline. Sharp negative readings appeared during late May and early June as selling pressure intensified.
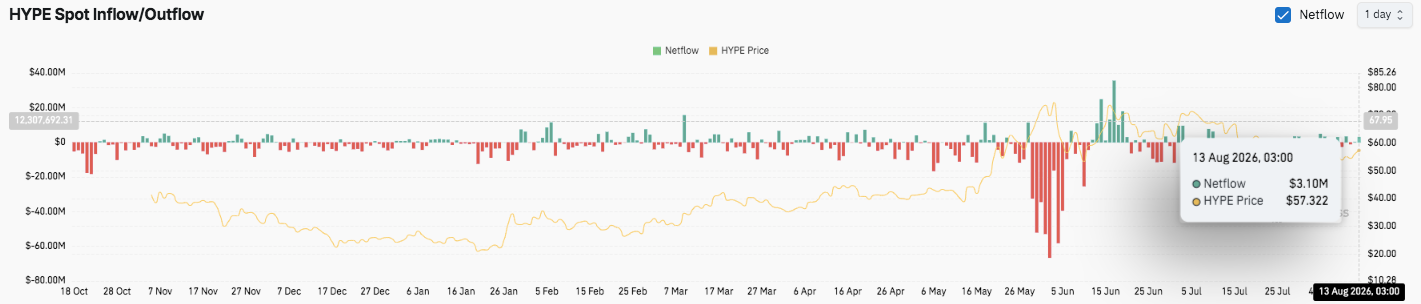
However, stronger inflows emerged around mid-June as HYPE recovered. The latest data shows approximately $3.1 million in net inflows, suggesting renewed buying interest.
Besides market flows, corporate demand could provide another supportive factor. Hyperion DeFi increased its HYPE holdings substantially during the second quarter. Its HYPE treasury value reached $133 million, compared with $71 million at the end of Q1.
The company also committed 500,000 HYPE to support Entropy’s HIP-3 deployment. Additionally, it pledged another 500,000 HYPE to Skew Technologies.
These commitments could increase HYPE’s utility across the Hyperliquid ecosystem. Moreover, stronger ecosystem participation could improve long-term demand beyond short-term trading activity.
Technical Outlook For Hyperliquid
Key levels remain well-defined as HYPE tests a critical breakout zone:
Upside levels: $58.03 and $60.00 represent the immediate hurdles. A sustained breakout above $60 could strengthen momentum and open the path toward higher psychological levels.
Downside levels: $55.84 offers initial support, followed by the $55.57–$55.27 EMA zone. Deeper support sits at $54.58, $53.77, and $52.77.
Resistance ceiling: $57.71–$58.03, particularly the 200 EMA, remains the key area to flip for stronger medium-term bullish momentum.
Will Hyperliquid Go Up?
Hyperliquid’s outlook depends on whether buyers can maintain HYPE above the $55.27 support zone while challenging $57.71–$58.03. A breakout above $58.03 could accelerate momentum toward $60, especially if open interest recovers above $2.5 billion. However, elevated Bollinger Band readings suggest short-term overheating, leaving room for a pullback.
Positive spot flows could reinforce accumulation, while renewed outflows may weaken the recovery. For now, HYPE remains in a pivotal zone, with $55.27 as the key defense and $58.03 as the decisive breakout level.
Disclaimer: The information presented in this article is for informational and educational purposes only. The article does not constitute financial advice or advice of any kind. Coin Edition is not responsible for any losses incurred as a result of the utilization of content, products, or services mentioned. Readers are advised to exercise caution before taking any action related to the company.