


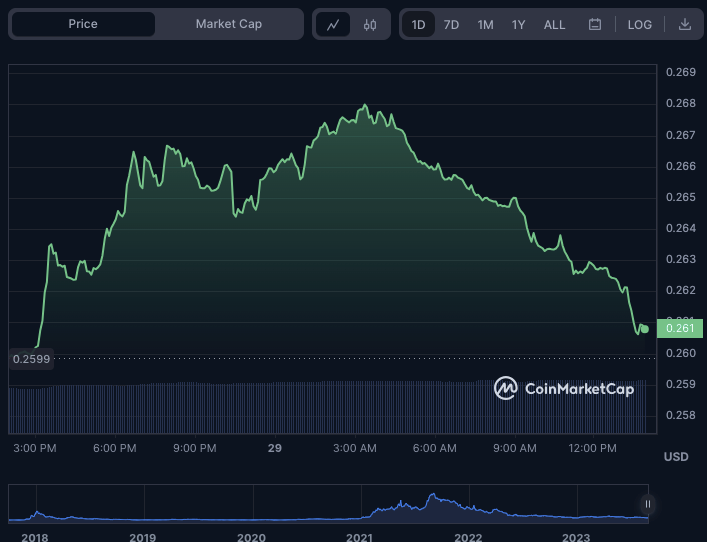
- ADA bulls push prices from a support level of $0.25 to an intraday high of $0.2681 in the last 24 hours.
- Technical indicators suggest caution as bullish momentum wanes.
- Will ADA’s support hold, or will the bulls swoop in to break through resistance?
Cardano (ADA) has maintained its strong trend in the previous 24 hours, rising from $0.2599 to $0.2681 before witnessing a modest retreat. A bullish breakthrough over the $0.2681 resistance level might set sights on the $0.2750 resistance level.
This breakout might draw additional purchasers, driving up the price of Cardano even more. Consequently, ADA was trading at $0.2612 at press time, up 0.52% from its previous low.
ADA’s market capitalization and 24-hour trading volume increased by 0.96% and 15.04%, respectively, to $9,161,041,700 and $162,043,670. This surge reflects the greater interest and activity in the ADA market, which may lead to a favorable market mood and increased purchasing pressure.
The stochastic RSI, meanwhile, is trending south with a value of 24.55, indicating that the ADA’s price may face a short-term downward correction. This pattern might be attributable to profit-taking by traders after the recent price increase. If the negative trend continues, it may be a buying opportunity for investors looking to enter the ADA market at lower prices.
Furthermore, the Moving Average Convergence Divergence (MACD) has moved below its signal line, reading -0.001, reflecting a bearish indication. This negative trend lends credence to the prospect of a short-term drop in the price of ADA. The histogram is additionally negative, indicating a possible decline in purchasing pressure and an increase in selling pressure.
ADA’s 2-hour price chart’s 20-day moving average is above the 100-day moving average, indicating a positive short-term trend. However, bullish momentum wanes as the shorter moving average is heading south (now at 0.263). This trajectory might result in reversing the short-term trend and a move toward a pessimistic outlook for ADA’s price.
A value of -1.13 for the Fisher Transform indicator on the ADA 2-hour price chart indicates that this negative momentum is growing. This pattern shows that the price of ADA may face a retracement soon. Reestablishing a bullish view necessitates the shorter moving average to resume its upward trend and the Fisher Transform indicator to return to positive territory.
In conclusion, while Cardano’s ADA has shown strength, caution is advised as indicators hint at potential short-term corrections before assessing renewed bullish momentum.
Disclaimer: The views, opinions, and information shared in this price prediction are published in good faith. Readers must do their research and due diligence. Any action taken by the reader is strictly at their own risk. Coin Edition and its affiliates will not be liable for direct or indirect damage or loss.
Disclaimer: The information presented in this article is for informational and educational purposes only. The article does not constitute financial advice or advice of any kind. Coin Edition is not responsible for any losses incurred as a result of the utilization of content, products, or services mentioned. Readers are advised to exercise caution before taking any action related to the company.
 Price Prediction 2026, 2027, 2028, 2029, 2030-2050")


