






- AEON holds above major EMAs as oversold RSI hints at a possible bullish rebound.
- Open interest surged to $6.86M, signalling rising trader participation and demand.
- Key resistance near $0.1092 could unlock further gains if buyers regain control.
AEON extended its recent market volatility after posting strong daily gains despite a weekly decline, leaving traders focused on whether the token can regain upward momentum. The digital asset climbed more than 22% over the past 24 hours, while remaining down nearly 17% over the last seven days.
At the time of writing, AEON traded near $0.05633 in the broader market, although short-term trading data placed the AEON/USDT pair around $0.1060. Technical indicators, rising derivatives activity, and changing exchange flows now suggest that the token has entered a decisive phase where the next move could determine its near-term direction.
Technical Indicators Point to a Critical Turning Point
The 15-minute chart shows AEON trading beneath its 20-day and 50-day exponential moving averages, highlighting weaker short-term momentum. However, the price continues to hold above both the 100-day and 200-day exponential moving averages. This structure indicates that buyers still defend the broader intraday trend despite recent selling pressure.
Additionally, the Stochastic RSI has dropped into oversold territory before beginning to turn higher. That shift suggests bearish momentum may weaken if fresh buying interest returns. Consequently, traders will closely monitor whether buyers can reclaim control during the next trading sessions.
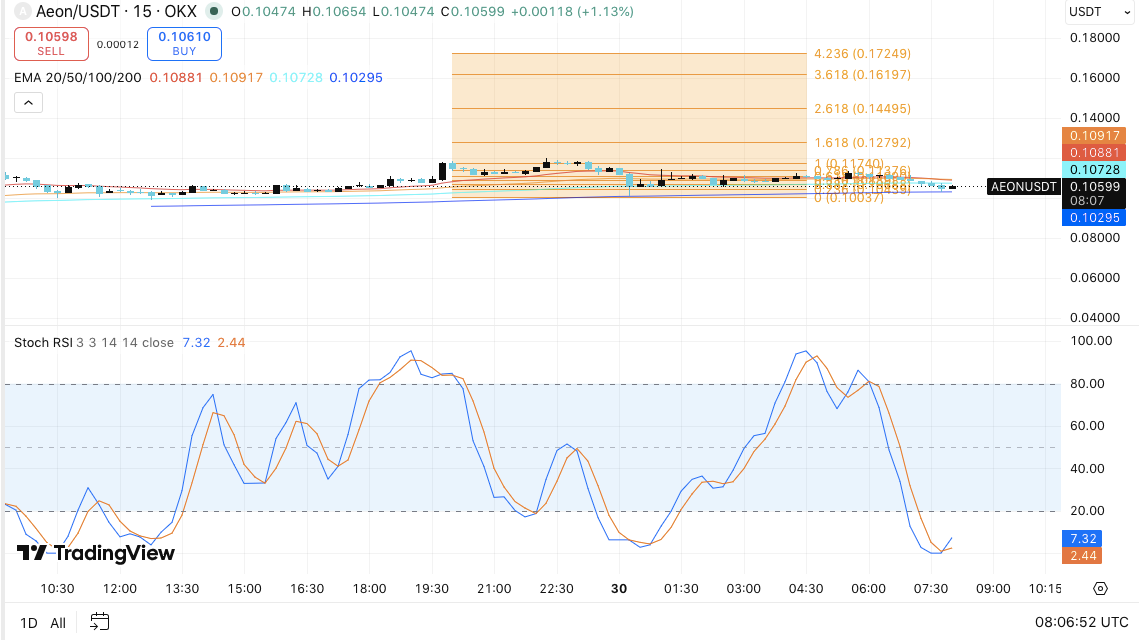
Immediate support sits between $0.1050 and $0.1060, where the current consolidation continues. Stronger support appears near the 200 EMA at $0.1030. A break beneath that level could expose the Fibonacci support at $0.1004 and strengthen downside pressure.
On the upside, resistance first appears at the 100 EMA around $0.1073. Moreover, the combined 20 EMA and 50 EMA zone between $0.1088 and $0.1092 remains the key hurdle. A confirmed move above those levels could open the path toward $0.1140. If bullish momentum accelerates further, Fibonacci extension targets stand at $0.1279, $0.1450, $0.1620, and $0.1725.
Open Interest and Exchange Flows Reflect Growing Speculation
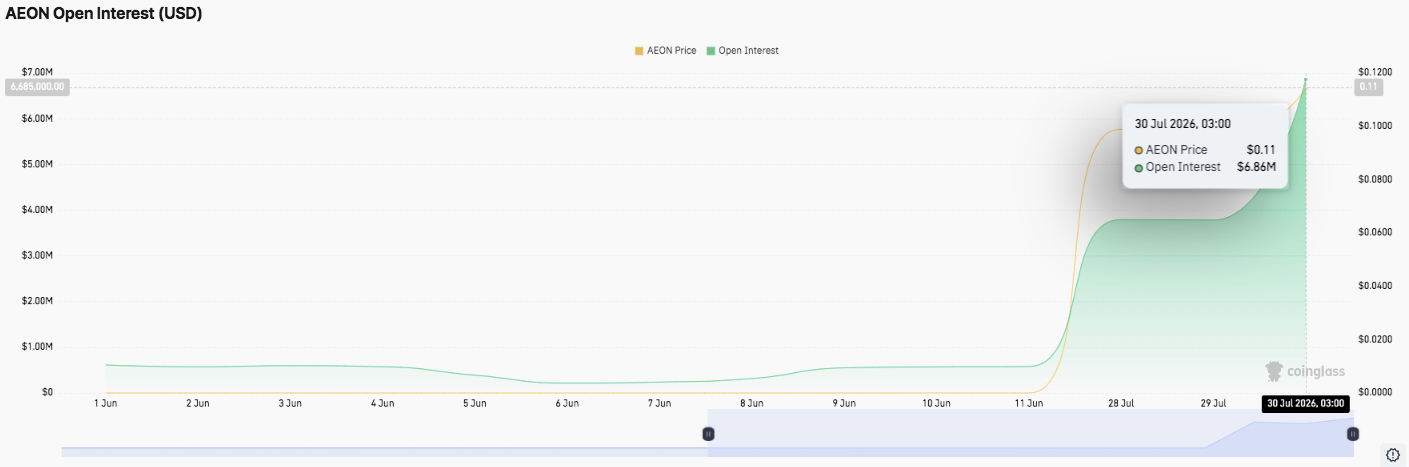
Derivatives data reveals a sharp increase in trader participation during recent sessions. Open interest remained below $1 million for much of June before surging to roughly $6.86 million alongside AEON’s rally toward $0.11. Significantly, rising prices combined with expanding open interest often indicate that new capital continues entering the market instead of existing positions merely rotating.
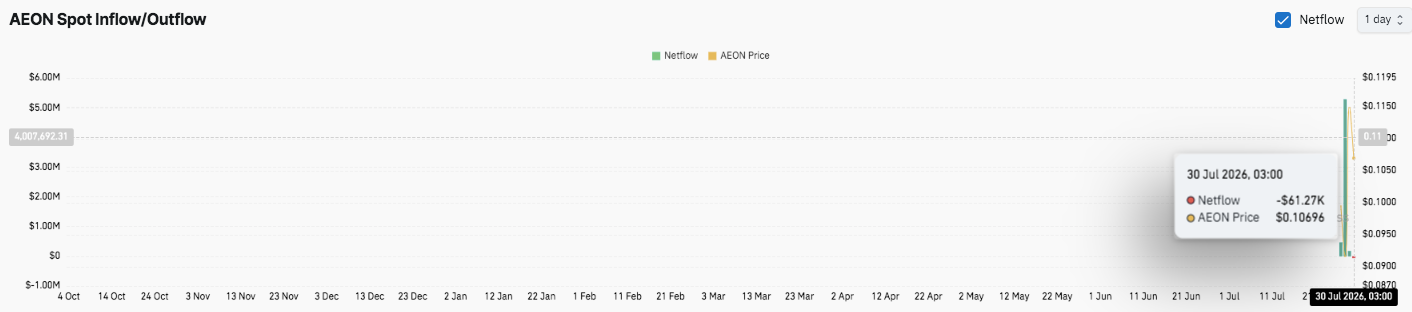
Meanwhile, exchange flow data paints a more complex picture. Spot activity remained relatively muted until a sudden spike pushed net inflows above $5 million.
That surge quickly faded as netflow turned negative, reaching approximately $61,270. The reversal suggests traders moved some holdings away from exchanges after the initial deposits, potentially reflecting repositioning rather than sustained selling pressure.
Technical Outlook for AEON Price
Upside levels: AEON faces immediate resistance around $0.1073, followed by the key $0.1088–$0.1092 EMA resistance zone. A confirmed breakout above this area could strengthen bullish momentum toward $0.1140, with further extension targets at $0.1279, $0.1450, $0.1620, and $0.1725 if buying pressure increases.
Downside levels: Initial support remains between $0.1050 and $0.1060, where buyers are currently defending the consolidation range. A breakdown below this zone could expose AEON to the $0.1030 support level, aligned with the 200 EMA. Further weakness may push the price toward $0.1004, which represents a critical Fibonacci support area.
Resistance ceiling: The $0.1088–$0.1092 region remains the major short-term level that AEON must reclaim to confirm a stronger recovery. A move above this zone would signal improving market structure and could attract additional buying interest.
The technical picture shows AEON consolidating after a strong rally, with short-term momentum weakening but oversold conditions suggesting a possible relief bounce. The Stochastic RSI has started recovering from oversold territory, indicating that selling pressure may be fading. However, elevated open interest highlights increased leverage in the market, which could create sharper price movements in either direction.
Will AEON Price Recover?
AEON’s near-term direction depends on whether buyers can defend the $0.1050–$0.1060 support zone and regain control above the $0.1092 resistance area. A successful breakout could open the path toward $0.1140 and higher Fibonacci extension targets as market confidence improves.
However, failure to maintain support around the 200 EMA at $0.1030 could weaken the recovery structure and expose AEON to deeper downside risks near $0.1004. Additionally, recent exchange flow volatility suggests traders remain active, with potential profit-taking and liquidity shifts influencing short-term price action.
For now, AEON remains positioned at a key decision point. Rising open interest, oversold momentum signals, and improving buyer activity create the possibility of a rebound, but confirmation through volume and resistance breaks will determine whether the next move becomes a sustained recovery or another decline.
Disclaimer: The information presented in this article is for informational and educational purposes only. The article does not constitute financial advice or advice of any kind. Coin Edition is not responsible for any losses incurred as a result of the utilization of content, products, or services mentioned. Readers are advised to exercise caution before taking any action related to the company.




