


")
- LUNC’s technical indicators point to a further downtrend.
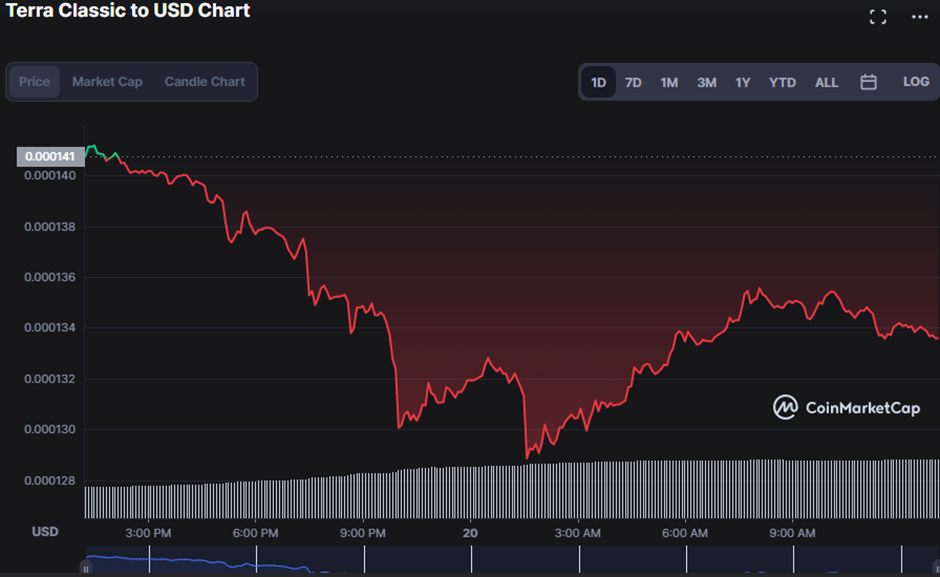
- As negative pressure persists, the price of LUNC tumbles to $0.0001343.
- If the LUNC price falls below the $0.0001288 support level, it may plunge more.
Terra Classic (LUNC) is ranked #43 with a market capitalization of $799,532,639 and a 24-hour trading volume of $84,230,936. The digital currency has had a 3.93% slump in the last 24 hours, with prices backtracking to $0.0001343.
As a result of the bears’ grip on the LUNC market, market capitalization fell by 4.38% while trading volume increased by 85.27%, indicating that selling pressure is increasing.
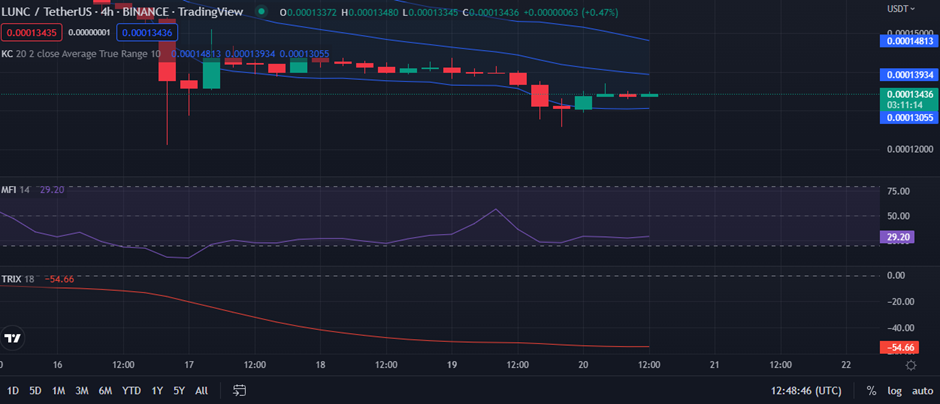
The southward contraction of the Keltner Channel bands on the 4-hour price chart, with the upper band hitting at 0.00014801 and the lower band touching at 0.00013062, is indicative of growing bearish strength. This bearish trend in the LUNC market is expected to persist as the price continues to move toward the lower band.
A Money Flow Index (MFI) score of 80 or above indicates overbought situations, while a reading of 20 or below indicates oversold conditions. As the MFI on the LUNC price chart reads 28.84 and approaches the oversold zone, this negative trend is expected to continue; however, an oversold situation indicates a buying signal.
A positive value in the TRIX indicator shows an increase in momentum, whereas a negative value indicates a reduction in momentum. According to the 4-hour price chart, bears may continue to exert dominance over the LUNC market, as the TRIX reading of -54.66 indicates that bear power is increasing, implying that prices may continue falling.
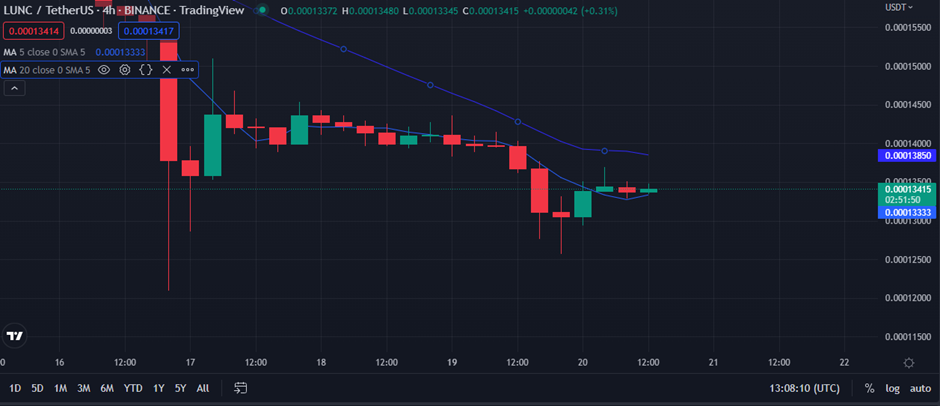
The tendency of the shorter-term MA to be below the longer-term MA supports this negative momentum. This is reflected by the 20-day MA reaching 0.00013334 and the 5-day MA touching 0.00013850. The price movement, which is trending towards the lower band, supports the view that bears are still in charge.
In conclusion, in order to halt the LUNC trading pattern’s downward trend, the bulls must maintain control of the resistance level and push prices higher.
Disclaimer: The views and opinions, as well as all the information shared in this price analysis, are published in good faith. Readers must do their own research and due diligence. Any action taken by the reader is strictly at their own risk, Coin Edition and its affiliates will not be held liable for any direct or indirect damage or loss.
Disclaimer: The information presented in this article is for informational and educational purposes only. The article does not constitute financial advice or advice of any kind. Coin Edition is not responsible for any losses incurred as a result of the utilization of content, products, or services mentioned. Readers are advised to exercise caution before taking any action related to the company.


