


- Trader and analyst @el_crypto_prof predicted that the altcoin market may break out in the coming few months.
- The analyst’s bullish prediction follows the altcoin market cap escaping a long-term negative trend.
- A breakout chart pattern formed on the daily chart of TOTAL2 could lead to a strong move to above $684.566 billion.
The cryptocurrency trader and analyst @el_crypto_prof predicted in an X post today that it is only a matter of time before the altcoin market surges. In the post, the analyst revealed that the market cap for altcoins had escaped a falling wedge pattern on its weekly chart. Subsequently, he believes that the market cap could rise to above $1.23 trillion in the coming months.
From a shorter-term perspective, a symmetrical triangle pattern has formed on the daily chart for the altcoin market cap (TOTAL2). This specific pattern suggests that a breakout may be in the cards for the altcoin market.
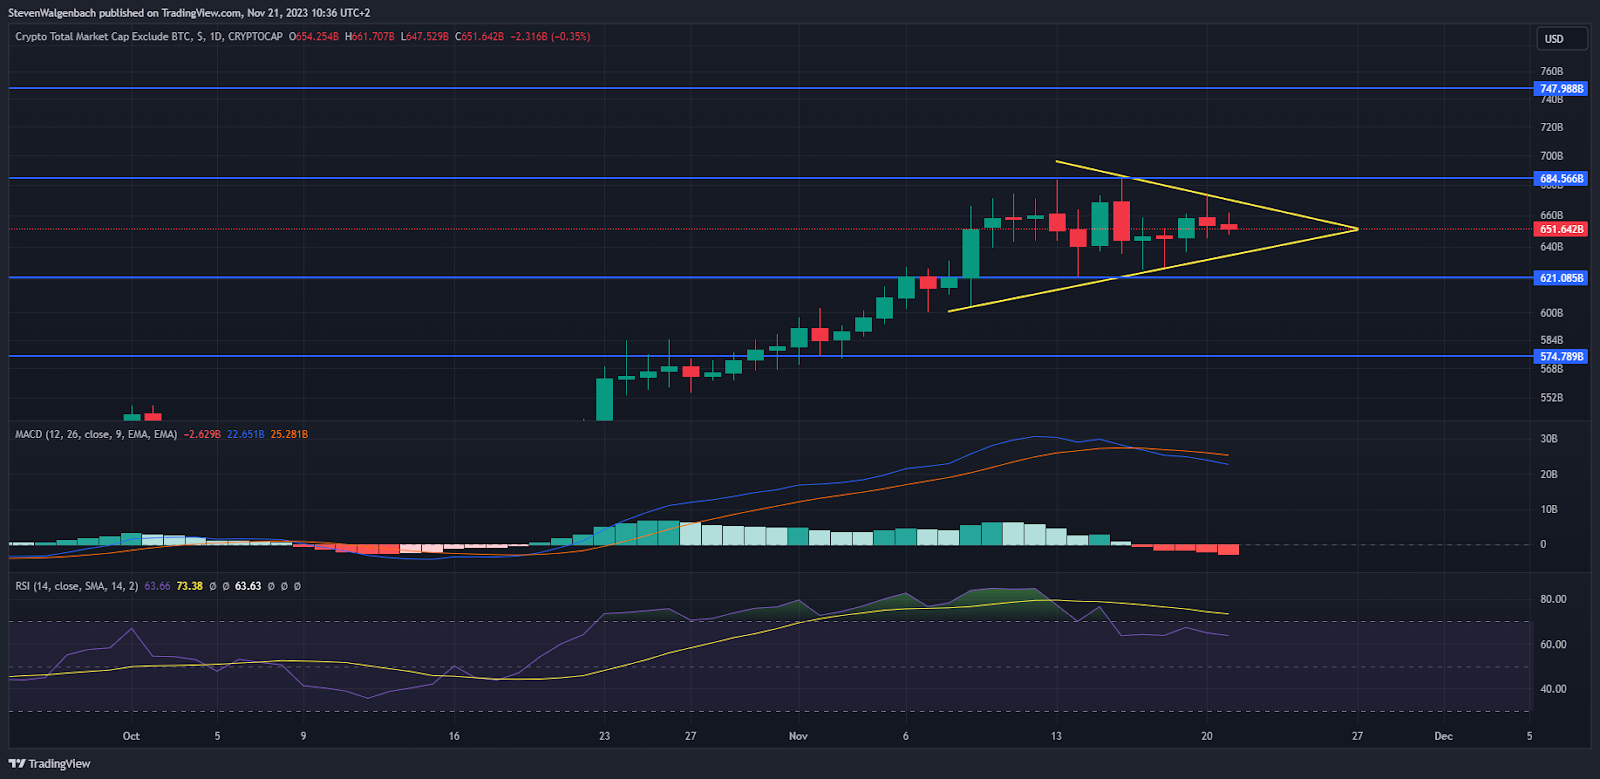
Should the altcoin market cap break towards the upside in the next few days, then it could attempt to flip the resistance level at $684.566 billion into support. Thereafter, a daily candle close above this mark could launch the altcoin market’s valuation to as high as $747.988 billion in the short term.
This bullish thesis may be invalidated if TOTAL2 drops below the triangle chart pattern that has emerged on its daily chart. A daily candle close below the pattern may then lead to the altcoin market’s capitalization retesting the key support level at $621.085 billion in the following 48-72 hours.
Should sellers continue to exert pressure on altcoins, the valuation could fall to $574.789 billion. Traders and investors will want to note that technical indicators on TOTAL2’s daily chart indicated that momentum was in favor of sellers.
At press time, the Moving Average Convergence Divergence (MACD) line was positioned below the MACD Signal line. This may be taken as a sign that TOTAL2’s negative trend may continue in the next couple of days.
In addition to this, the daily Relative Strength Index (RSI) line was positioned below the RSI Simple Moving Average (SMA) line. Normally, this indicates that sellers have more strength than bulls. This means that it is currently easier for sellers to force TOTAL2 down than it is for bulls to boost it.
Disclaimer: The information presented in this article is for informational and educational purposes only. The article does not constitute financial advice or advice of any kind. Coin Edition is not responsible for any losses incurred as a result of the utilization of content, products, or services mentioned. Readers are advised to exercise caution before taking any action related to the company.


