


 Tumbles as SEC Labels It a Security in Kraken Lawsuit")
- Kraken’s SEC lawsuit rocks Solana (SOL) and the crypto market, with SOL dropping 5.53%.
- Solana’s substantial trading volume amidst the dip hints at potential recovery opportunities.
- MACD and RSI indicators signal bearish momentum for the SOL/USD trading pair.
The US Securities and Exchange Commission’s recent lawsuit against Kraken has sent ripples through the cryptocurrency market. The accusation, which points to Kraken’s alleged operation as an unregistered securities exchange, broker, and clearing agency, has notably affected Solana (SOL) and several other cryptocurrencies.
Solana’s Market Reacts to Legal Developments
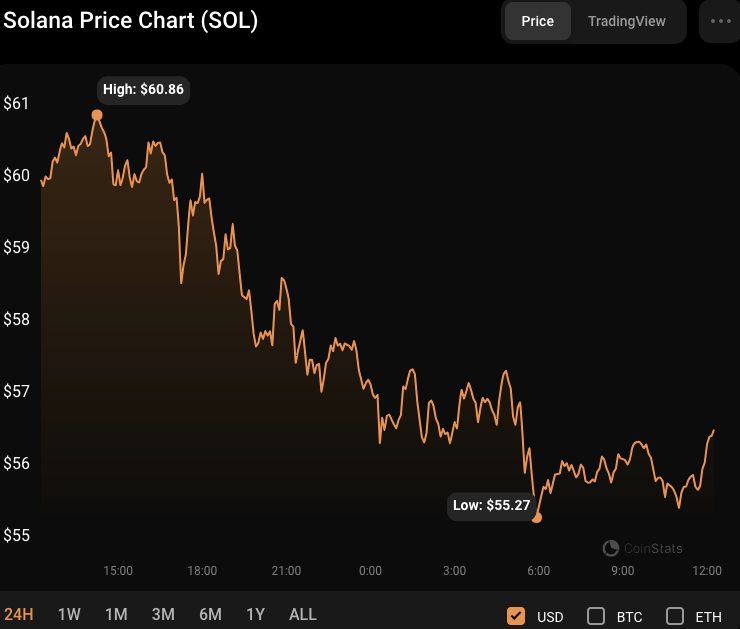
In response to the SEC’s filing, SOL’s market value has experienced notable fluctuations. From a 24-hour peak of $60.92, Solana’s price fell to a low of $55.36 before stabilizing somewhat. At the time of reporting, SOL is trading at $55.97, marking a 5.53% decrease from its intra-day high.
If this bearish trend persists and the intra-day low of $55.36 is breached, the next significant support will be around $50. Conversely, a rebound from this point could see Solana retest its previous high of $60.92, signaling a potential upward trend.
Despite the downturn, Solana’s market cap is $23,707,817,936, reflecting a 5.80% decrease. However, its 24-hour trading volume has surged 11.30% to $1,966,486,642. This increase in trading volume implies sustained interest and activity in SOL trading, even amid market challenges.
Investors may perceive the current price dip as an opportunity to buy, which could soon foster a market recovery. Moreover, the heightened trading volume of Solana also points to significant market liquidity, which is crucial for the cryptocurrency’s stability and growth potential.
SOL/USD Technical Analysis
The Moving Average Convergence Divergence (MACD) on the 24-hour price chart has moved below its signal line, indicating a negative indicator. The shift in the MACD signals a possible reversal of momentum to the negative. Furthermore, the histogram has turned negative, reinforcing the bearish indication.
The Relative Strength Index (RSI) has moved below its signal line, reading 61.98, adding to the bearish divergence. This RSI pattern shows a weakening of bullish momentum and increased selling pressure. If the RSI continues to decrease and goes below the 50 mark, it might reinforce the negative picture and lead to more price declines.
In conclusion, Solana faces uncertainty amid the SEC’s lawsuit against Kraken, with bearish signals in its technical analysis. However, its strong liquidity and increased trading volume could pave the way for a potential market recovery.
Disclaimer: The information presented in this article is for informational and educational purposes only. The article does not constitute financial advice or advice of any kind. Coin Edition is not responsible for any losses incurred as a result of the utilization of content, products, or services mentioned. Readers are advised to exercise caution before taking any action related to the company.


