


 Could Be Set for a New High")
- An analyst noted that SOL’s position above $75 was good for the price action.
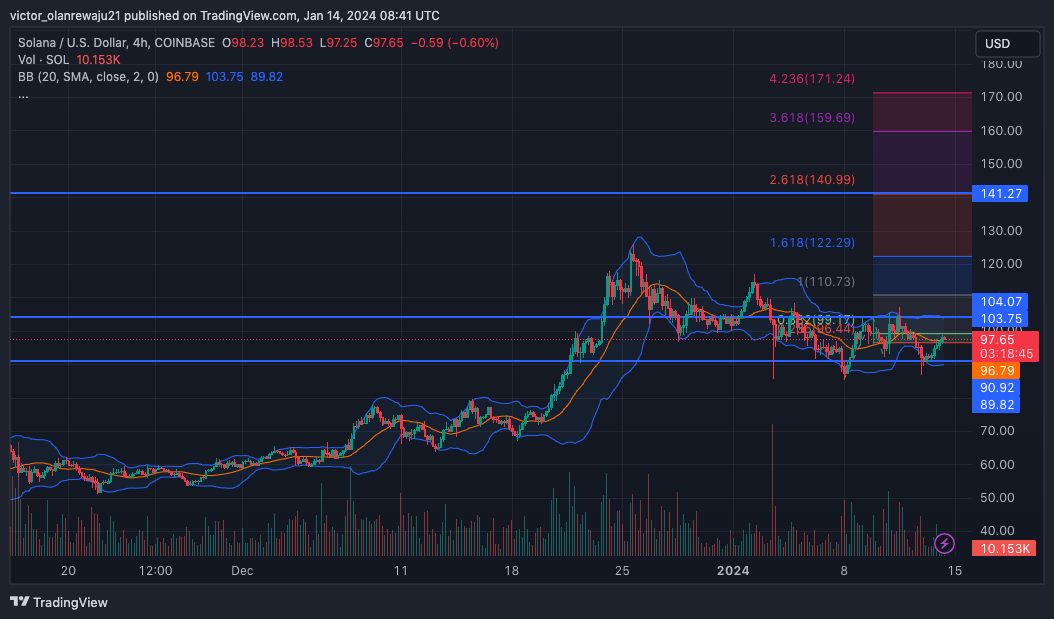
- If buying pressure intensifies, SOL might ascend to $141.27.
- The odds do not entirely favor the upside due to indications from the DMI.
According to trader Crypto Tony, as long as Solana (SOL) trades above $75, the cryptocurrency remains in a bullish position. Tony made his opinion known on X (formerly Twitter) on January 13.
Via his post, the trader also showed a weekly chart of SOL, indicating that the price could soon rise above $140.
Recently, SOL experienced a significant pullback as the broader market went through a notable correction. During that period, the SOL price fell to $92.95 despite rising above $110 a few days before that.
However, CoinMarketCap’s data showed that the value of the token recovered to $97.62. On January 13, SOL extended a lower leg down to $90.92 due to enhanced selling pressure.
Despite that, bulls made a bold attempt to revive the price by capitalizing on the same region and using it as support.
With Solana trading above the lower band of the Bollinger Bands (BB), the price could extend to $104.07. However, this would only be the case if bulls maintain a solid presence in the market.
In a highly bullish case, SOL might ascend to $141.27 where the 2.618 Fib extension was located. However, that would require the price to hit $103.75 which was the 0.382 Fib level, and could act as support for the potential upside.
But if bears come into the picture, SOL might drop below $90. However, the momentum displayed at press time, showed that it is highly unlikely.
A look at the RSI showed that buyers have been outpacing sellers. At press time, the RSI was 52.77. If the indicator rises higher, it could offer support for the bullish thesis initially discussed.
A retest of the 67.52 RSI reading could push SOL to $125, a price last seen on Christmas day. Moreover, the Average Directional Index (ADX) was at 15.69, indicating a neutral stance in terms of a strong or weak direction.
At the same time, the +DMI (green) and -DMI (red) were in a close contest. This suggests that SOL bulls had not entirely taken bears out of the way. To achieve this, the ADX (yellow) needs to exit its flat condition and rise above 25.
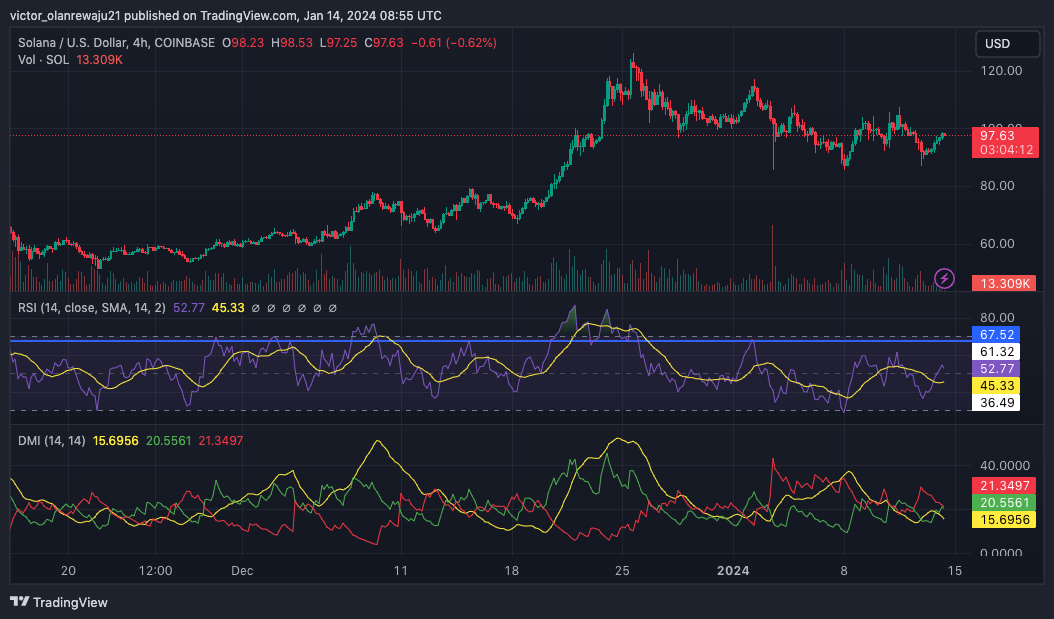
Also, the +DMI should overpower the -DMI. If this occurs, then SOL’s bullish trend could be confirmed. If not, the cryptocurrency might keep trading sideways.
Disclaimer: The information presented in this article is for informational and educational purposes only. The article does not constitute financial advice or advice of any kind. Coin Edition is not responsible for any losses incurred as a result of the utilization of content, products, or services mentioned. Readers are advised to exercise caution before taking any action related to the company.


