


")
- An analyst predicted that BNB’s price could break out towards the upside despite Binance’s legal struggles.
- At press time, BNB was worth $232.59 after its price dropped by over 3% in the past day.
- Should BNB close today’s trading session above $230, it may attempt to challenge the $240 resistance level again.
The cryptocurrency trader and analyst Ali revealed in an X post earlier today that Binance Coin (BNB) could still break out towards the upside even though Binance is facing a series of legal challenges. Furthermore, the analyst noted that a bearish descending triangle has formed on BNB’s weekly chart.
Nevertheless, Ali shared that BNB closing above $260 could be a confirmation of the altcoin entering into a bullish move. Until then, he thinks it may be best to “hold steady.”
Over the past 24 hours, BNB saw its price drop 3.45% according to the cryptocurrency market tracking website CoinMarketCap. As a result of this latest decrease in price, BNB was changing hands at $232.59 at press time. Despite this 24-hour loss, the cryptocurrency’s weekly performance remained in the green at +1.59%.
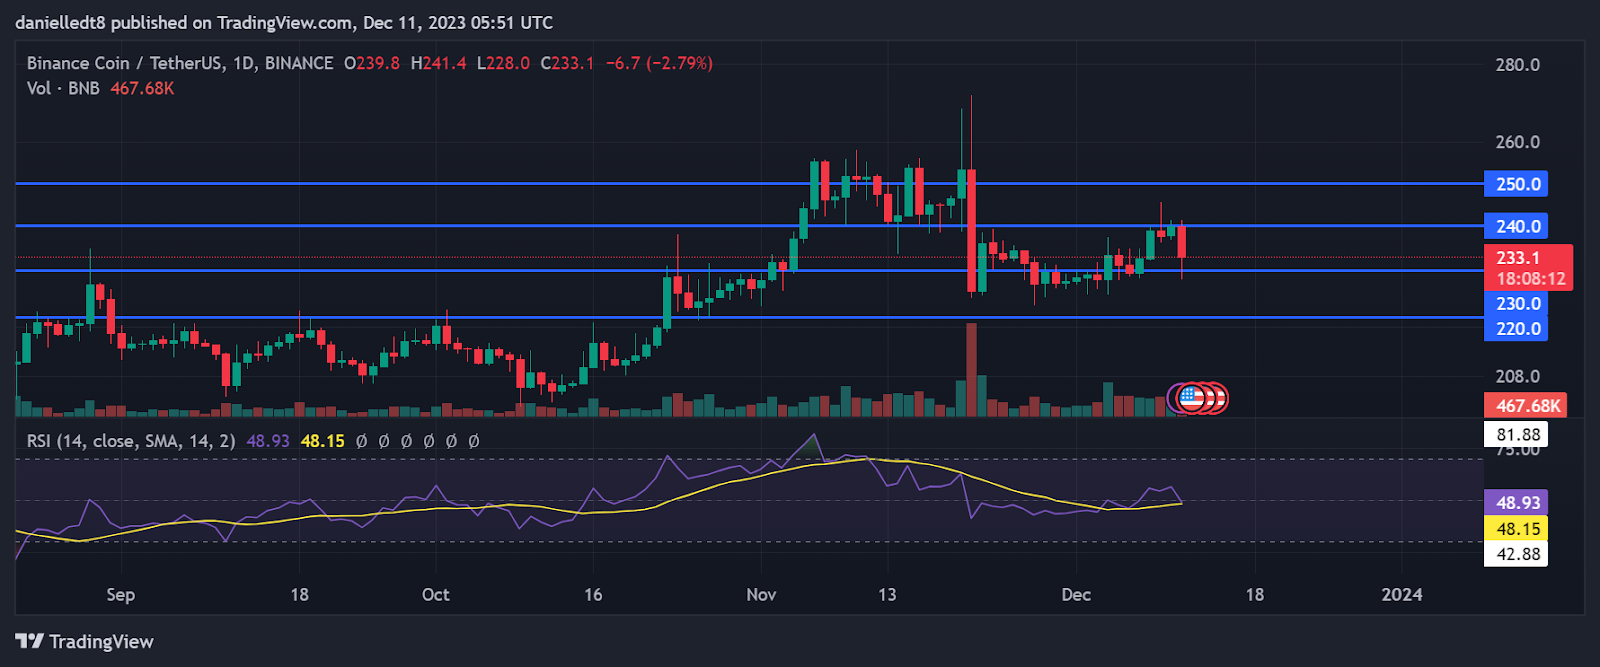
From a short-term technical perspective, BNB was rejected by the $240 resistance level over the past 24 hours. This caused the altcoin’s price to fall to below $230 earlier in today’s trading session. Since then, bulls have boosted BNB’s value to back above $230.
Should BNB close today’s trading session above $230, it may make another attempt at the $240 resistance level. If it can close a daily candle above this mark, it will have a clear path to rise to $250 in the following few days. Conversely, a daily candle close below $230 today could lead to BNB falling to the next key support level at $220.
‘Traders and investors will want to note that a significant bearish technical flag was on the verge of being triggered. At press time, the Relative Strength Index (RSI) line was attempting to cross below the RSI Simple Moving Average (SMA) line. Should these two lines cross, it could signal that sellers have gained the upper hand against buyers on BNB’s chart.
Disclaimer: The information presented in this article is for informational and educational purposes only. The article does not constitute financial advice or advice of any kind. Coin Edition is not responsible for any losses incurred as a result of the utilization of content, products, or services mentioned. Readers are advised to exercise caution before taking any action related to the company.
 Price Prediction 2026, 2027, 2028, 2029, 2030-2050")


