


- EGRAG CRYPTO revealed that XRP is in a positive trend on its weekly chart.
- A snapshot of XRP’s weekly chart shows that XRP may rise above $0.7.
- A descending triangle on XRP’s daily chart could foreshadow a correction.
The cryptocurrency trader and analyst EGRAG CRYPTO revealed in an X (formerly Twitter) post earlier today that Ripple (XRP) is in a bullish trend on its weekly chart. Included in the post was a snapshot of the altcoin’s weekly chart, which showed that the remittance token was resting on the key support level at around $0.6119.
Despite the altcoin currently retesting support, EGRAG CRYPTO’s post showed that the cryptocurrency could climb to above $0.70 should the positive trend continue. Looking at the last 24 hours, XRP was able to post a 1.73% gain during this period.
As a result, the altcoin was changing hands at $0.6128 at press time, according to CoinMarketCap. However, the increase in price throughout the past day of trading was not enough to flip the altcoin’s weekly performance, which remained in the red zone at -1.88%.
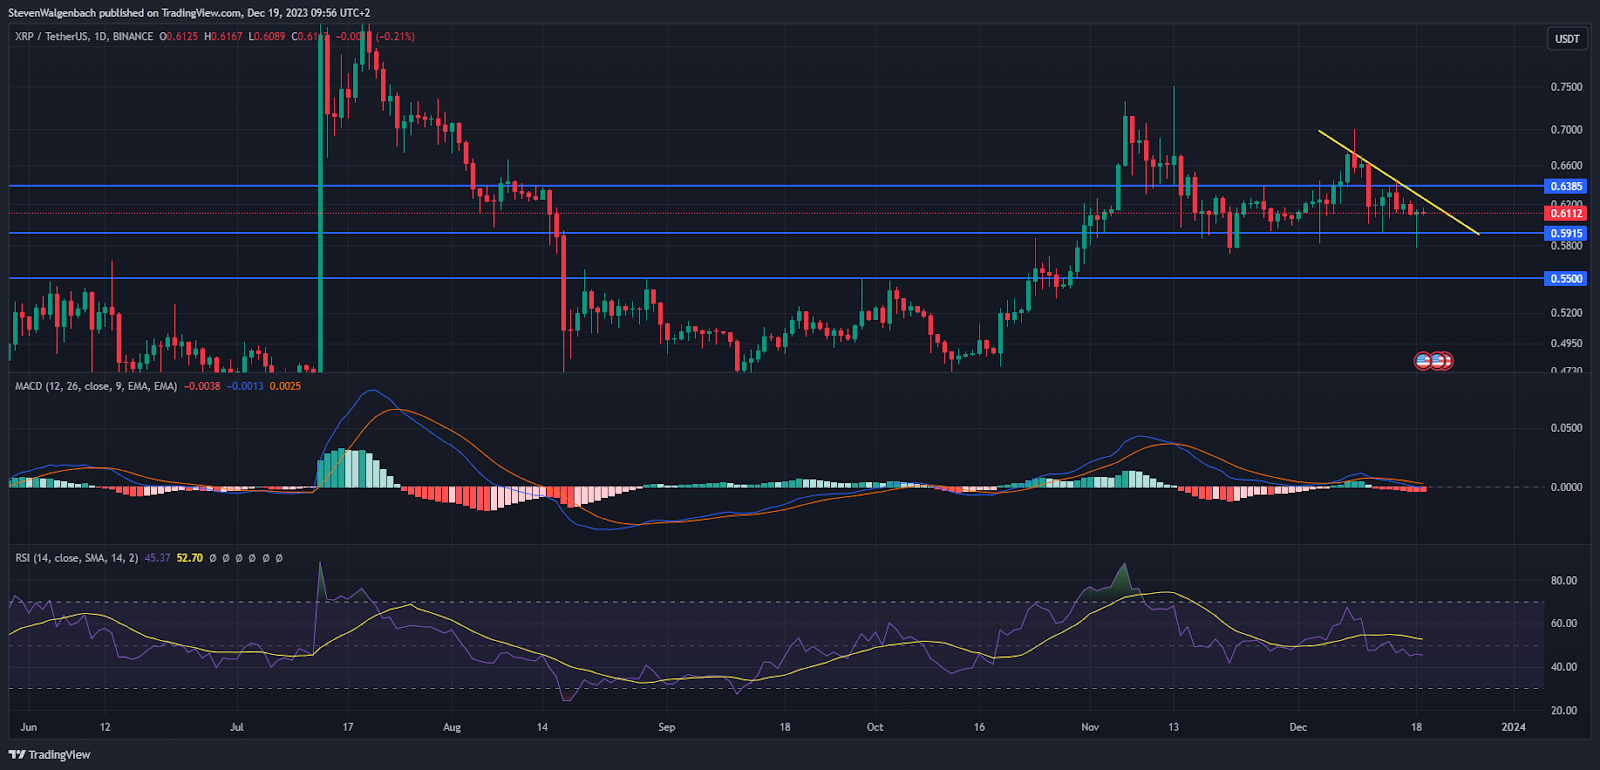
From a short-term technical perspective, a bearish descending triangle has formed on XRP’s daily chart. Should this pattern be validated, the altcoin may fall below the base of the pattern at $0.5915 in the next few days. Thereafter, a daily candle close below this mark could expose XRP to the risk of dropping to $0.55 in the short term.
This bearish thesis may be invalidated if XRP can break out of the triangle chart pattern in the next 48 hours. In this more bullish scenario, the remittance token could attempt to flip the $0.6385 resistance level into support.
Technical indicators on XRP’s daily chart support a bearish short-term outlook. Both the Moving Average Convergence Divergence (MACD) and Relative Strength Index (RSI) indicators suggested an increase in bearish pressure.
The MACD line was breaking away below the MACD Signal line, which is indicative of the bearish trend growing stronger. Meanwhile, the RSI line was positioned below the RSI Simple Moving Average (SMA) line at press time. This is generally seen as a sign that bears have more strength against bulls.
Disclaimer: The information presented in this article is for informational and educational purposes only. The article does not constitute financial advice or advice of any kind. Coin Edition is not responsible for any losses incurred as a result of the utilization of content, products, or services mentioned. Readers are advised to exercise caution before taking any action related to the company.


