


- APECoin struggles to increase during the past week, the price barely reached $2.1.
- APEcoin forms two consecutive head and shoulder patterns with similarities.
- Traders may need to be vigilant to cash in on the next surge.
The past week hasn’t been a successful one for the governance token ApeCoin of the APE Ecosystem. On June 10, APE was trading hands at an opening market price of $2.91. However, towards the end of the same day, APE was barely above $2, trading at around $2.1.
From June 11 to 14, APE was fluctuating within a tight range of $2.1 and $2.4. Within these four days, APE was able to touch the upper limit of this range only once. During this period, the $2.20 was the go-to support level for APEcoin.
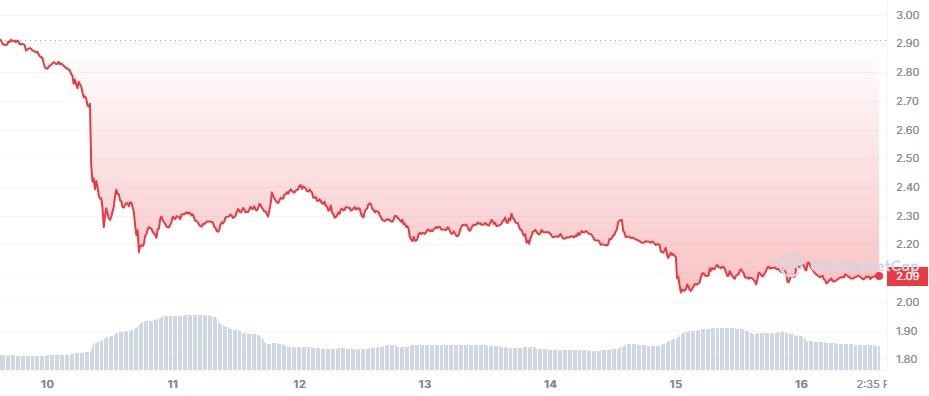
APE/USD 1-Week Chart (Source: CoinMarketCap)
However, come the early hours of June 15, APE took another significant fall. APE fell below the $2.1 mark, and thereafter it has been testing and at times fluctuating above the $2.1 level. At press time, APE is priced at $2.08 after losing 0.01% of its price during the last 24 hours.
When considering the bigger picture of APE, it is evident that the coin has been forming the head and shoulders pattern since June 2022. Moreover, when scrutinizing the pattern of APEcoin’s fluctuation, it could be noted that after every fall there was a head and shoulder pattern formation.
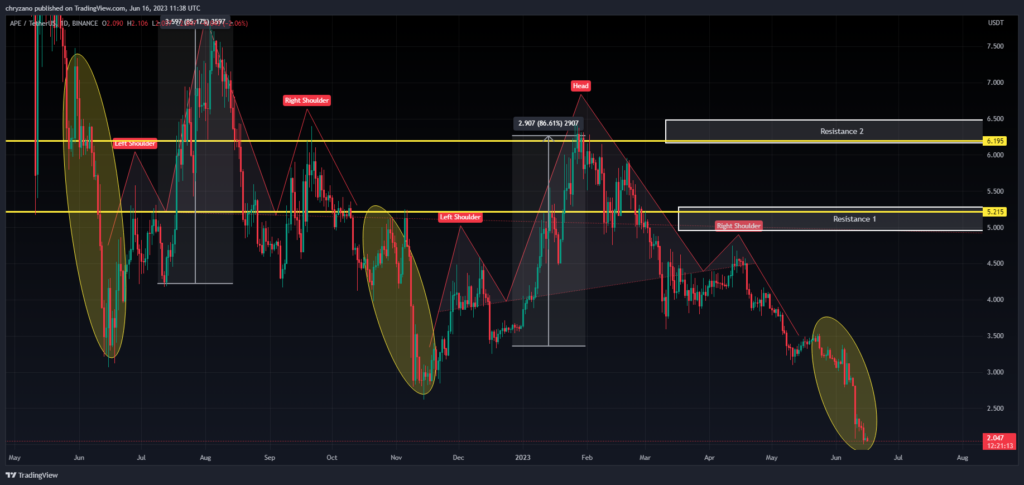
APE/USDT 1-Day Trading Chart (Source: Tradingview)
Moreover, there are certain uniformities and dissimilarities that could be seen in the head and shoulders pattern shown above in the chart. For instance, when the formation of the head is considered ( i.e. from the low of the left shoulder – the high of the head), both patterns exhibit an 85% equal increase in price. Hence, we could expect the prices to increase by 85% when APE completes forming the left shoulder of the next pattern.
As far as dissimilarities are concerned, APE’s fall has been dwindling as it progress. Notably, when APE’s fall highlighted by the yellow ellipticals is considered, the price loss has been reduced. It could be that the token is strengthening, or it has reached its bottom.

APE/USDT 1-Day Trading Chart (Source: Tradingview)
It seems like APE has reached the bottom, as such, it may start to surge at any given time. Moreover, since APEcoin has touched the lower Bollinger band, we may see the prices rising within the band. Additionally, the bands are widening, hence, we may see a massive movement in the upwards direction.
As such, buyers need to pay attention and monitor the market closely and choose their entry and exit points wisely. It will be advisable for those going long to enter the market as they spot the next higher low. However, there could be a market correction, as such they’ll need to give enough slack for APE with the stop loss.
Nonetheless, those reluctant to enter the market right now may join, when APE completely forms the left shoulder and reaches the neckline. If buyers enter at the neckline they could expect a price action of 85% based on the previous observations of APE.
Disclaimer: The views and opinions, as well as all the information shared in this price analysis, are published in good faith. Readers must do their own research and due diligence. Any action taken by the reader is strictly at their own risk. Coin Edition and its affiliates will not be held liable for any direct or indirect damage or loss.
Disclaimer: The information presented in this article is for informational and educational purposes only. The article does not constitute financial advice or advice of any kind. Coin Edition is not responsible for any losses incurred as a result of the utilization of content, products, or services mentioned. Readers are advised to exercise caution before taking any action related to the company.


