


- APT and ARB could be part of the biggest gainers out of the plethora of new cryptocurrencies.
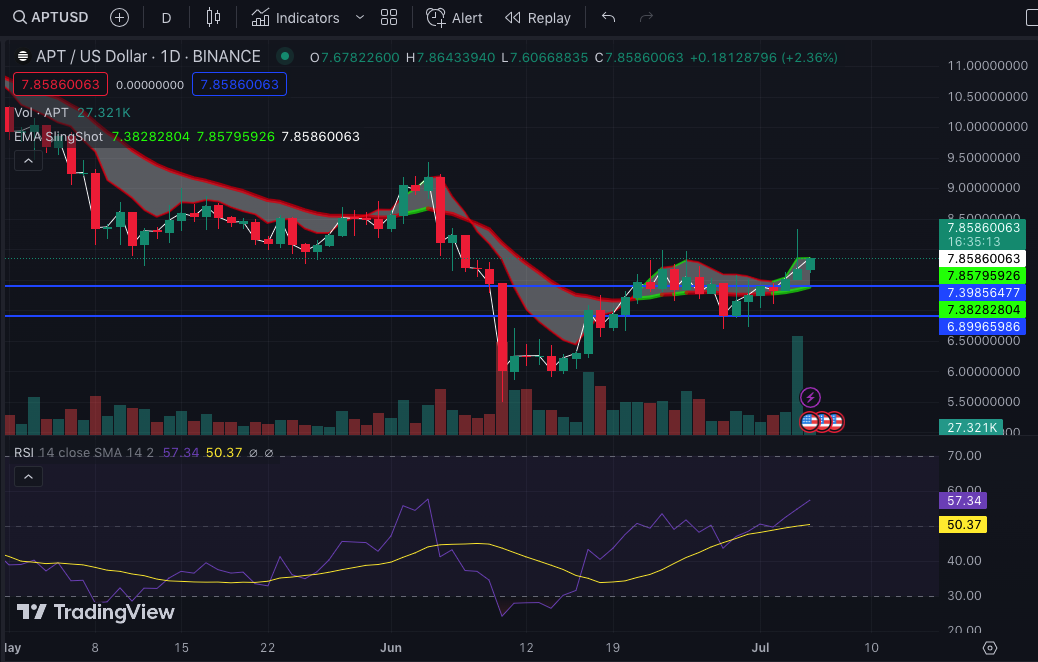
- Successive bullish candles appeared on the APT/USD chart, highlighting the possibility of a continuous uptrend.
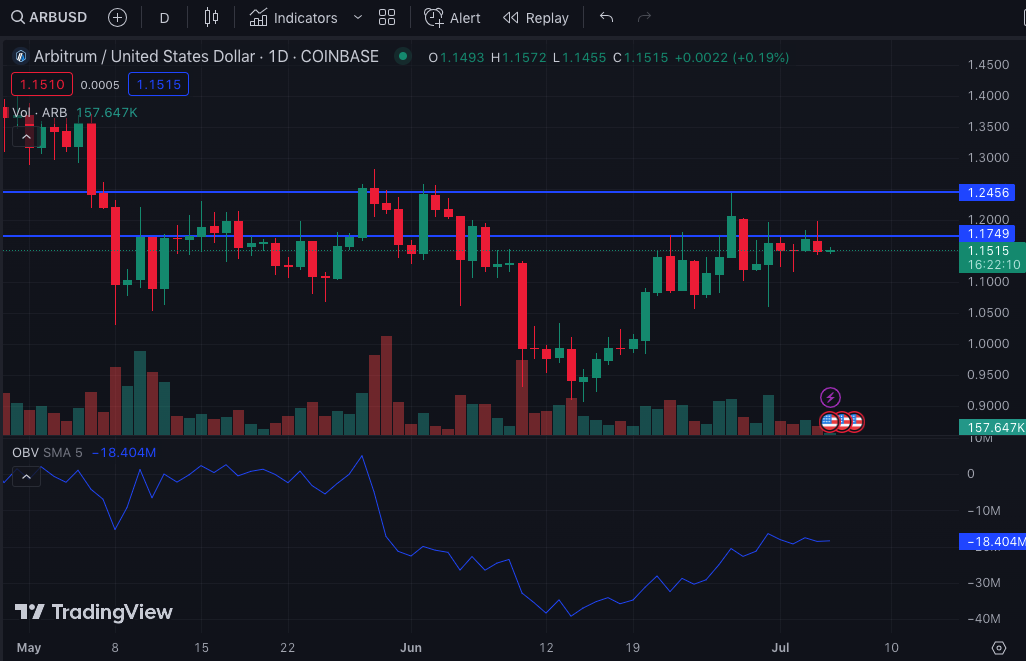
- ARB was dealing with selling pressure but the OBV implied that respite was close.
Popular analyst and founder of MN Trading Michaël van de Poppe told his 660,000 followers that Arbitrum (ARB) and Aptos (APT) may be the biggest gainers of the next bull cycle. According to the analyst, the narrative around new cryptocurrencies could play a big role in the move.
Although ARB and APT are newly-launched cryptocurrencies, the tokens have been ranked as two of the most adopted ones. While Aptos’ Mainnet launched in October 2022, Arbitrum began its journey into the market in March 2023 and has proven to be relevant in the eyes of market participants.
Aptos (APT)
For Aptos, CoinMarketCap showed that it has been able to sustain a 9.83% hike in the last seven days. According to the daily APT/USD chart, demand for the token has been increasing after it recovered from a sharp plunge to $6.89 on June 28.
As of this writing, the Exponential Moving Average (EMA) Slingshot crafted a bullish pattern. This was because the pattern shown by APT was characterized by successive bullish candles and a higher one on the daily timeframe.
However, APT may need to close above the high of the second bullish candle at $7.39 to confirm the continuation of the bullish bias. Unless this happens, APT could pull back before another return to the uptrend.
Meanwhile, the Relative Strength Index (RSI) showed that APT’s buying momentum was solid at 57.30. Therefore, the token’s short-term price action could remain green as long as the RSI does not cross into the overbought level.
Arbitrum (ARB)
On the other hand, ARB has struggled to surge above the local top at $1.24 which it hit on June 27. Also, the token has faced numerous selling pressure, leading the price to fall to $1.15. This was also a result of the failure to fend off resistance at $1.17.
But the On-Balance-Volume (OBV) showed that ARB had the potential for an upward breakout. At press time, the OBV had risen significantly.
Despite being in the negative region, the increasing OBV reflects a rising volume pressure. Thus, this could neutralize distribution, and lead to higher prices in the short to mid-term.
In conclusion, van de Poppe’s opinion seemed to match the status of the indicators discussed. Regardless, traders might need to watch out for external factors that could impact the current market trend before deciding to open long positions on APT and ARB.
Disclaimer: The views, opinions, and information shared in this price prediction are published in good faith. Readers must do their research and due diligence. Any action taken by the reader is strictly at their own risk. Coin Edition and its affiliates will not be liable for direct or indirect damage or loss.
Disclaimer: The information presented in this article is for informational and educational purposes only. The article does not constitute financial advice or advice of any kind. Coin Edition is not responsible for any losses incurred as a result of the utilization of content, products, or services mentioned. Readers are advised to exercise caution before taking any action related to the company.


