


- APT’s price broke out of a long-term bullish chart pattern over the past few weeks.
- If the bearish momentum continues, APT’s price may drop to the next support level at $3.20.
- A 4-hour candle close above $5.40 may invalidate the bearish thesis and could lead to APT climbing to $8.
The price of Aptos (APT) broke out of a medium-term bullish chart pattern, but not in the way that APT holders had hoped for. Instead of the altcoin’s price breaking out towards the upside, it entered into a multi-week long bearish period, which saw it decline gradually. As a result of the continued price drop over the past few weeks, APT’s price is at risk of plummeting to $3.20.

APT’s price broke out of a bullish falling wedge chart pattern over the past few weeks. It then consolidated for a few days before its price started to gradually decline in the last 2 weeks. As a result, the altcoin’s price dropped below the key $5.40 support level, where it continued to trade at press time. Consequently, APT was at risk of revisiting the crucial $3.20 support level.
This bearish thesis may be invalidated if APT is able to close a daily candle above the recently-breached $5.40 mark. Thereafter, continued buy support may ignite a move that could elevate the cryptocurrency’s price to $8. In an extreme bullish scenario, APT’s price may continue to rise to $10 as well.
Investors and traders will want to take note of the mixed sentiment on APT’s daily chart. On one hand, the MACD line was positioned bullishly above the MACD Signal line at press time. Meanwhile, the daily RSI was below 45, which was a bearish sign. Nevertheless, the overall trend on APT’s charts was bearish at press time.
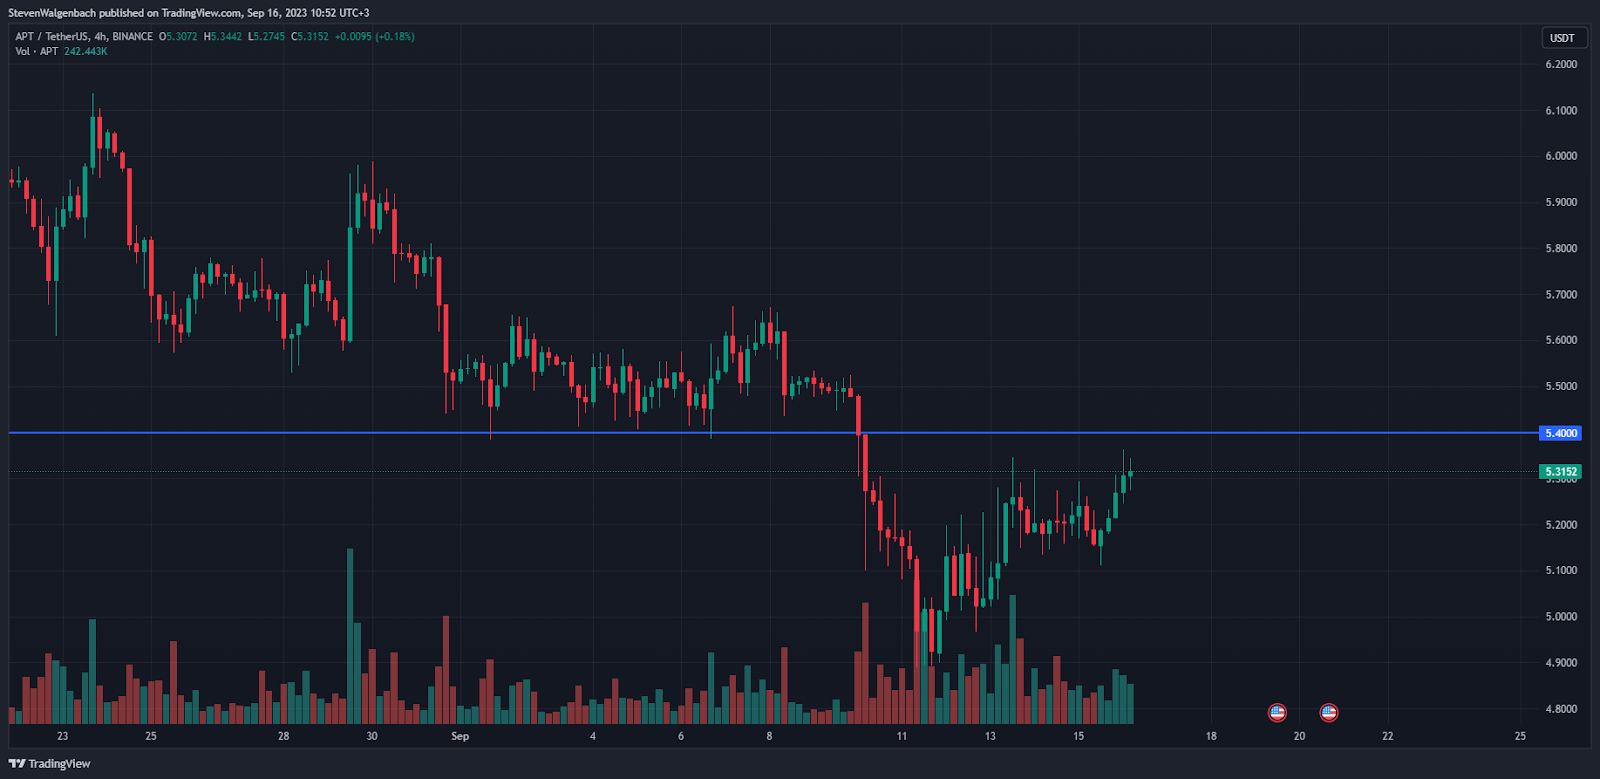
From a shorter-term time frame perspective, APT had been in a positive sequence over the past 24 hours, as it consistently printed higher lows on the 4-hour chart during this period. Subsequently, the altcoin’s price may have the support needed to overcome the $5.4 barrier within the coming 24 hours, provided that this bullish momentum continues.
On the other hand, if APT fails to close a 4-hour candle above $5.40 within the next 48 hours, then it may be at risk of continuing the long-term negative trend that had plagued its charts over the past few months. In this scenario, the altcoin’s price may decline to the previously-mentioned $3.20 support.
Disclaimer: The views and opinions, as well as all the information shared in this price analysis, are published in good faith. Readers must do their own research and due diligence. Any action taken by the reader is strictly at their own risk. Coin Edition and its affiliates will not be held liable for any direct or indirect damage or loss.
Disclaimer: The information presented in this article is for informational and educational purposes only. The article does not constitute financial advice or advice of any kind. Coin Edition is not responsible for any losses incurred as a result of the utilization of content, products, or services mentioned. Readers are advised to exercise caution before taking any action related to the company.
 Price Prediction 2026, 2027, 2028, 2029, 2030 -2050")


