


- Aptos (APT) maintains positive momentum despite minor setbacks.
- Bulls target the $8.50 resistance level in the APT price surge.
- APT/USD market shows a bullish trend, with potential for further gains.
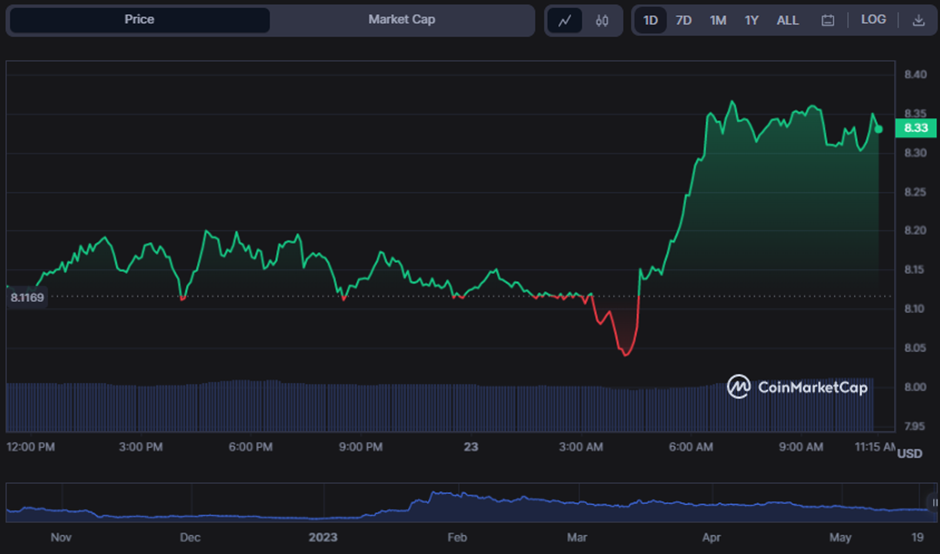
Despite a minor setback that dropped the price to $8.04, Aptos’s (APT) positive momentum has remained in charge in the previous 24 hours. During the bull run, the APT price reached a 24-hour high of $8.37 before collapsing. As of this writing, bullish momentum remained intact, resulting in a 2.72 percent increase to $8.34.
During the rally, APT’s market capitalization and 24-hour trading volume increased by 2.71% and 11.22%, respectively, to $1,647,338,621 and $69,574,379.
If bulls break over the $8.37 barrier level, the next resistance level might be $8.50. However, if the bears seize control, the $8.20 support level may come into play.
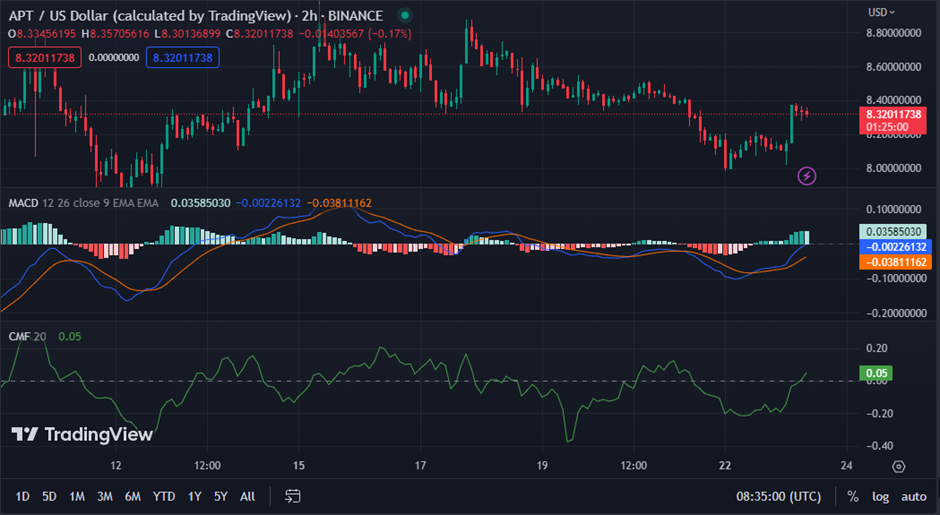
The MACD line in the APT/USD 2-hour price chart is moving towards the positive area, with a value of -0.00358814, indicating that bulls are gaining strength.
This movement indicates the APT/USD bullishness may persist since buyers are gaining control. The histogram advances into a positive zone, indicating a more substantial possibility of an upward trend, adding to the bullishness.
The positive trend in the APT/USD market is set to continue, with a Chaikin Money Flow (CMF) rating of 0.05 and going higher. If the CMF rises further, it may imply further purchasing pressure, driving the market even higher.
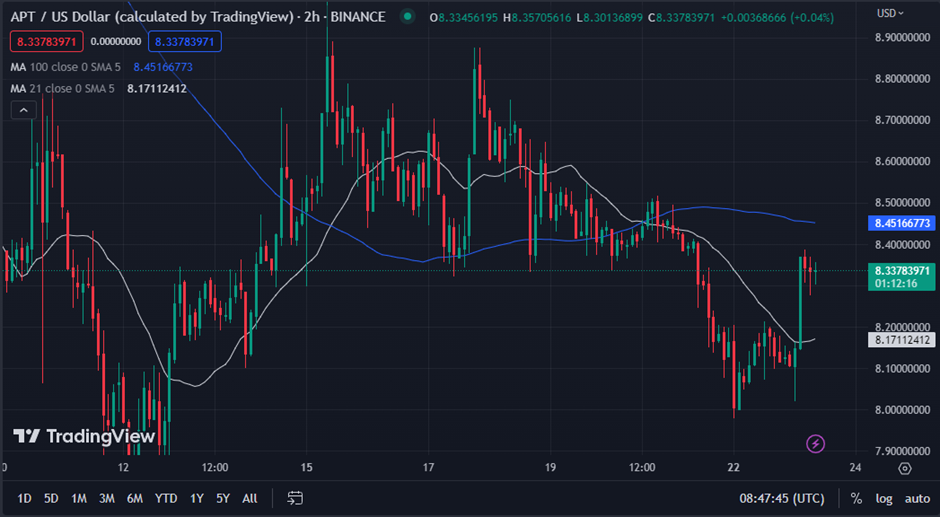
With readings of $8.17082294 and $8.45160448, the 21-day moving average (white) falls below the 100-day moving average (blue). This movement shows that APT’s bullishness is losing steam, and a possible negative trend is brewing.
However, the price movement has recovered off the 21-day MA with massive green candlesticks, indicating that there may still be some positive enthusiasm in the market.
In conclusion, Aptos shows signs of bullish strength despite minor setbacks, with potential for further upward momentum in the market.
Disclaimer: The views, opinions, and information shared in this price prediction are published in good faith. Readers must do their research and due diligence. Any action taken by the reader is strictly at their own risk. Coin Edition and its affiliates will not be liable for direct or indirect damage or loss.
Disclaimer: The information presented in this article is for informational and educational purposes only. The article does not constitute financial advice or advice of any kind. Coin Edition is not responsible for any losses incurred as a result of the utilization of content, products, or services mentioned. Readers are advised to exercise caution before taking any action related to the company.


