

- ETH trades at $1,889.44 on August 12, up 0.46%, compressing inside a triangle on the 4H chart with a breakout above $1,950 targeting $2,150
- Spot ETH ETFs logged $1.76M in outflows on August 11 and $14.59M the day before, snapping five consecutive weeks of net inflows
- The weekly ETF flow has turned negative at -$16.35M through two sessions, though three days remain and outflow magnitude stays modest
The Ethereum price prediction points to $2,150 on the bullish side and $1,837 on the bearish side, with ETH trading at $1,889.44 today as a bullish triangle compresses on the 4H chart toward a breakout decision.
Ethereum Price Analysis: ETH Holds $1,889 as a Triangle Breakout Loads
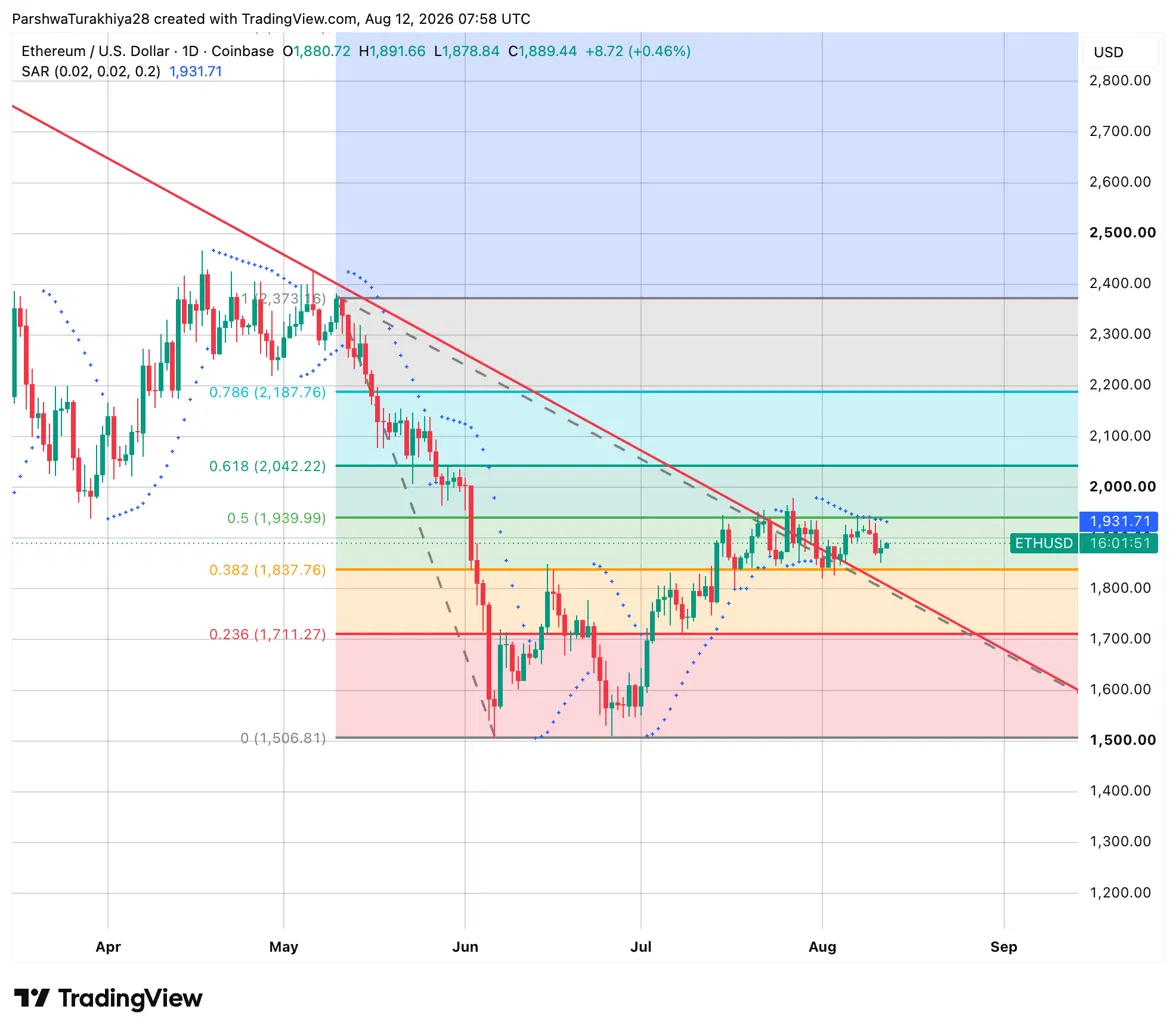
ETH is holding between the 0.382 Fibonacci at $1,837.76 and the 0.5 level at $1,939.99, with the descending trendline from the May peak near $2,373 still sloping through the $1,900 to $1,940 area. Today’s session opened at $1,880.72, pushed to $1,891.66, and is holding at $1,889.44, pressing directly against that trendline.
Related: Cardano Price Prediction: ADA Retreats From $0.20 as Analyst Warns of a Slide to $0.170
The Parabolic SAR, a trend-following indicator that flips sides as momentum shifts, sits at $1,931.71 and remains bearish above price, meaning a daily close above $1,931 is still needed to flip it bullish and confirm a trend change.
The 4H Triangle Pattern Traders Are Watching
Analyst Crypto With Gopal flagged a bullish triangle forming on the 4H timeframe, a pattern where price compresses between rising support and descending resistance, typically reflecting accumulation and tightening momentum rather than genuine indecision. Bulls have been defending higher lows throughout the compression, and a clean breakout above the $1,950 to $2,000 zone could trigger a move toward $2,150.
A smaller triangle from early July resolved to the upside before this larger one formed, giving the current pattern a recent precedent of breaking bullish rather than bearish.
ETH Support and Resistance Levels, August 12, 2026
| Type | Price | Level |
| Resistance | $1,931.71 | Parabolic SAR, must flip for trend change |
| Resistance | $1,939.99 | 0.5 Fibonacci and descending trendline |
| Resistance | $1,950 to $2,000 | Triangle breakout trigger per Gopal |
| Resistance | $2,042.22 | 0.618 Fibonacci |
| Resistance | $2,150 | Triangle measured move target |
| Support | $1,837.76 | 0.382 Fibonacci, key floor |
| Support | $1,711.27 | 0.236 Fibonacci |
| Support | $1,506.81 | June low, Fibonacci base |
ETH ETF Flows: Five-Week Streak Snaps but Outflows Stay Modest
Spot ETH ETFs recorded a $1.76M daily outflow on August 11, following a $14.59M outflow on August 10, according to SoSoValue. That puts the current week at -$16.35M through just two sessions, snapping five consecutive weeks of net inflows that brought in $244.94M, $27.42M, $103.90M, $105.44M, and $84.42M respectively.
Three sessions remain in the week, and the outflow magnitude is small relative to the prior inflow run, which leaves the streak’s longer-term picture intact for now.
BlackRock’s ETHA was the only product to log a positive day on August 11, pulling in $563.84K. Fidelity’s FETH shed $2.33M, and every other product recorded zero flow. Cumulative net inflows across all products still hold at $11.44B, with total net assets at $10.48B.
| Week | Weekly Net Flow |
| Aug 7, 2026 | $244.94M |
| Jul 31, 2026 | $27.42M |
| Jul 24, 2026 | $103.90M |
| Jul 17, 2026 | $105.44M |
| Jul 10, 2026 | $84.42M |
| Aug 11, 2026 (partial, 2 days) | -$16.35M |
ETH Derivatives Data: Positions Unwind as Longs Absorb the Pain
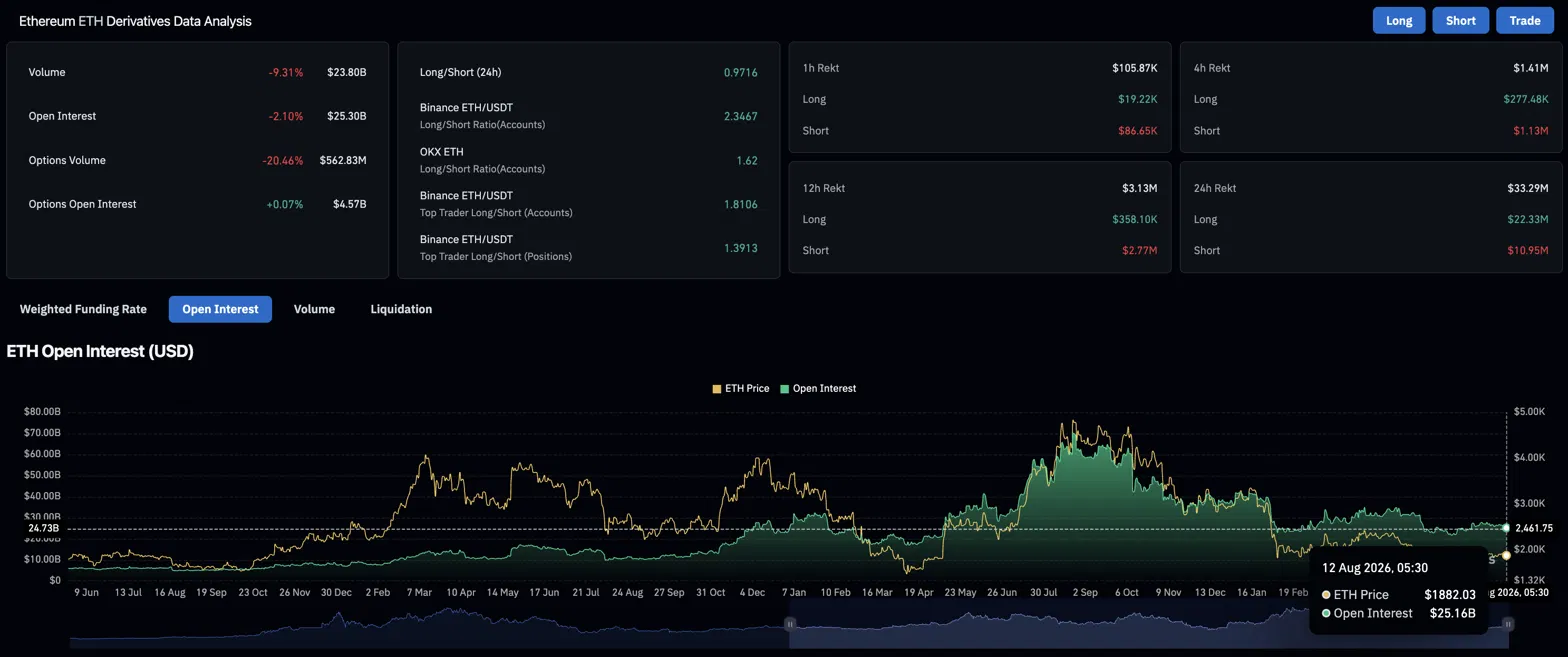
Volume fell 9.31% to $23.80B and open interest, the total value of futures contracts still open on the market, dropped 2.10% to $25.30B. Both falling together points to traders closing positions rather than placing new bets. Options volume fell 20.46% to $562.83M, while options open interest held nearly flat at $4.57B.
The overall long/short ratio of 0.9716 is slightly net short, though Binance retail at 2.3467 and OKX at 1.62 both lean long, with top trader accounts at 1.8106 and position sizing at 1.3913 also net long.
Related: Velvet Price Prediction: VELVET Price Eyes $0.716 as Open Interest Falls From June Peak
Liquidations over 24 hours totaled $33.29M, with longs absorbing $22.33M against $10.95M for shorts. That two-to-one ratio in favor of longs taking the pain reflects the uncertainty around the triangle breakout, with buyers holding positions despite overhead resistance keeping price compressed.
| Metric | Value | Interpretation |
| 24h Volume | $23.80B (-9.31%) | Quieter session, positions unwinding |
| Open Interest | $25.30B (-2.10%) | Positions being closed |
| Long/Short Ratio (24h) | 0.9716 | Slightly net short overall |
| Top Trader L/S (Positions) | 1.3913 | Large accounts net long |
| 24h Liquidations | $33.29M | Longs absorbed twice the shorts’ pain |
Will ETH Break Out to $2,150? Bullish and Bearish Price Targets
Bull Case, Target: $2,150 (Triangle Measured Move)
ETH breaks above the 4H triangle upper boundary and clears the $1,950 to $2,000 zone on a daily close, flipping the Parabolic SAR bullish above $1,931. The descending trendline from May breaks as the triangle resolves to the upside, and ETF outflows prove to be a two-day interruption rather than a trend reversal as weekly flows recover through the remaining three sessions. Price pushes through the 0.618 Fibonacci at $2,042.22 toward the $2,150 measured move target.
Bear Case, Risk Level: $1,837 (0.382 Fibonacci)
The triangle upper boundary and the descending trendline reject price again and ETH loses the 0.5 Fibonacci at $1,939.99 on a daily close. ETF outflows extend through the remaining sessions of the week, turning the five-week inflow streak into a confirmed reversal. The 0.382 Fibonacci at $1,837.76 becomes the next meaningful support, with the 0.236 at $1,711.27 as the deeper floor if selling accelerates.
Conclusion
ETH’s setup right now comes down to a genuine tug-of-war between a bullish chart pattern and a fading fundamental tailwind. The 4H triangle has real precedent behind it, since the last comparable pattern in July broke to the upside, but the ETF flow streak that helped drive ETH’s recent strength just interrupted itself for the first time in over a month.
Neither signal is decisive alone. A daily close above $1,950 to $2,000 would confirm the triangle and put $2,150 in play, while a continuation of ETF outflows through the rest of the week would tilt the setup toward $1,837 instead.
FAQs Related to Ethereum Price Prediction
ETH trades at $1,889.44 and is compressing inside a bullish triangle. The bullish target is $2,150; the bearish risk level is $1,837 (0.382 Fibonacci) if the triangle rejects.
It’s a compression pattern where price tightens between rising support and descending resistance, typically reflecting accumulation. A clean breakout above $1,950 to $2,000 could trigger a move toward the $2,150 measured move target, and a similar triangle in early July resolved bullish.
Spot ETH ETFs logged $16.35M in outflows over two sessions, ending a five-week streak that had brought in over $560M total. The magnitude is small relative to that prior run, and three sessions remain in the current week.
A daily close above the $1,950 to $2,000 zone would confirm the triangle breakout and flip the Parabolic SAR bullish above $1,931, opening the path toward $2,042 and then $2,150.
Volume and open interest both fell, suggesting traders are closing positions rather than adding new ones. Longs absorbed twice as much liquidation pain as shorts over the last 24 hours, reflecting real uncertainty around which way the triangle breaks.
ETH has a technically constructive triangle setup, but the ETF outflow streak and falling open interest add real near-term uncertainty. Weigh the bullish and bearish cases above against your own risk tolerance.
Disclaimer: The information presented in this article is for informational and educational purposes only. The article does not constitute financial advice or advice of any kind. Coin Edition is not responsible for any losses incurred as a result of the utilization of content, products, or services mentioned. Readers are advised to exercise caution before taking any action related to the company.