


- Crypto investor opines $69,000 is not the highest that BTC could reach.
- BTC took the form of two steps in a staircase on the third and fourth days.
- RSI makes lower-highs while BTC records higher-highs, the bull run could be over.
Crypto investor and educator, Lark Davis tweeted that $69,000 was not the highest that Bitcoin (BTC) could reach. Further clarifying his views on the potential that BTC has, the crypto investor stated “the next cycle will easily take us over $100,000”.
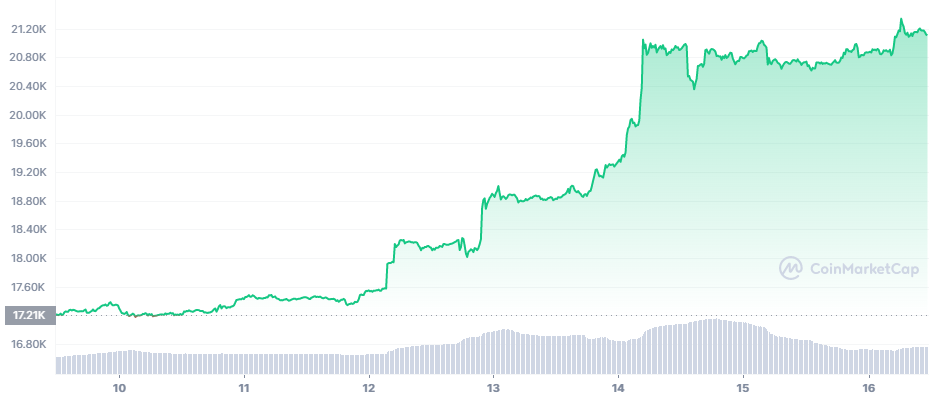
When taking a closer look at the chart below, BTC kicked off the week trading at $17,200. It fluctuated between the $17,200 and $17,600 range for the first two days of the week. On the third day of the week, the bulls helped BTC break above the $17,600 mark that it was constricted to.
BTC rose to take the form of two steps in a staircase on the third and fourth days. Notably, the height of both steps is quite similar, although the width was different. The difference in width was because BTC exhibited more sideways movement on the fourth day than on the third.
The bulls took full control of the market on the fifth day and BTC, which was trading at $19,346 at the beginning of the day, spiked to $21,047 within just a few hours. BTC has been trading in the $20,800 and $21,200 range since the fifth day. It reached a maximum of $21,268 during its rally. Currently, BTC is priced at $21,112 and is up 1.86% in the last 24 hours.
As shown in the chart below, it has been exponentially increasing. This bullish sentiment is due to BTC forming higher-highs simultaneously with RSI forming higher-highs (green circles). Specifically, BTC was $18,406 when the RSI was 85.72, and then when BTC rose to $21,253, the RSI rose to 92.60.
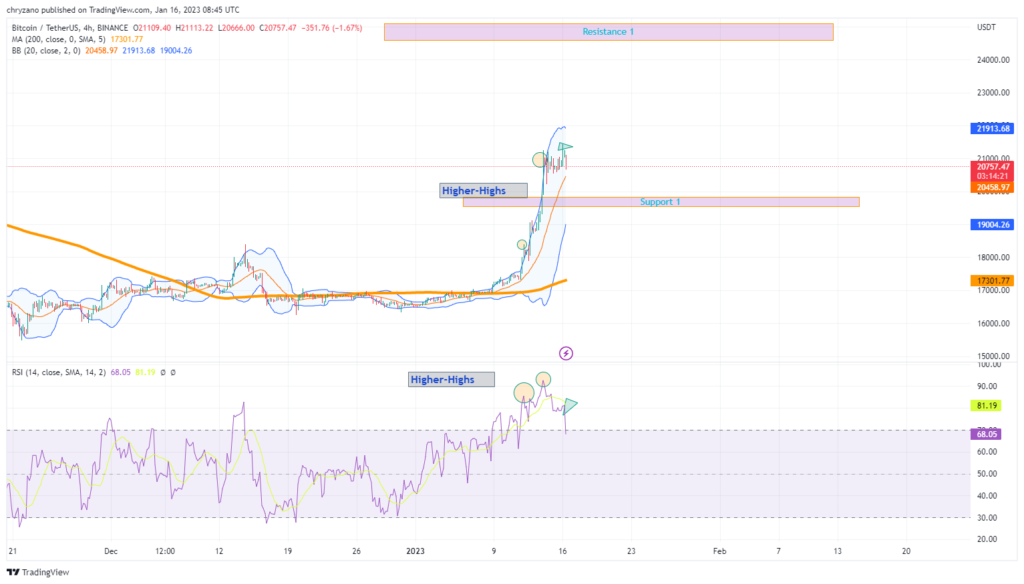
Although the current RSI is at 69.96 and nearing the overbought region, BTC could still be on the bull run as the RSI value was much higher previously. However, opposing this sentiment, RSI dropped to a lower-high when BTC made a higher-high as shown in triangles, hence a trend reversal could be on the horizon.
Moreover, the widening Bollinger bands denote that there could be more volatility on the horizon. This supports the trend reversal sentiment. If the bears dominate, BTC may fall to Support 1. But if the bulls continue BTC may hit Resistance 1.
Disclaimer: The views and opinions, as well as all the information shared in this price analysis, are published in good faith. Readers must do their own research and due diligence. Any action taken by the reader is strictly at their own risk, Coin Edition and its affiliates will not be held liable for any direct or indirect damage or loss.
Disclaimer: The information presented in this article is for informational and educational purposes only. The article does not constitute financial advice or advice of any kind. Coin Edition is not responsible for any losses incurred as a result of the utilization of content, products, or services mentioned. Readers are advised to exercise caution before taking any action related to the company.
 Price Prediction 2026, 2027, 2028, 2029, 2030-2050")
 Price Prediction 2026, 2027, 2028, 2029, 2030-2050")


