


- Helium sways high by a double figure of 13.25% in the past 24 hours.
- Technical indicators foresee the bullish outburst is set to stay in the HNT market.
- If the bulls push harder HNT could break $3.2, the key resistance.
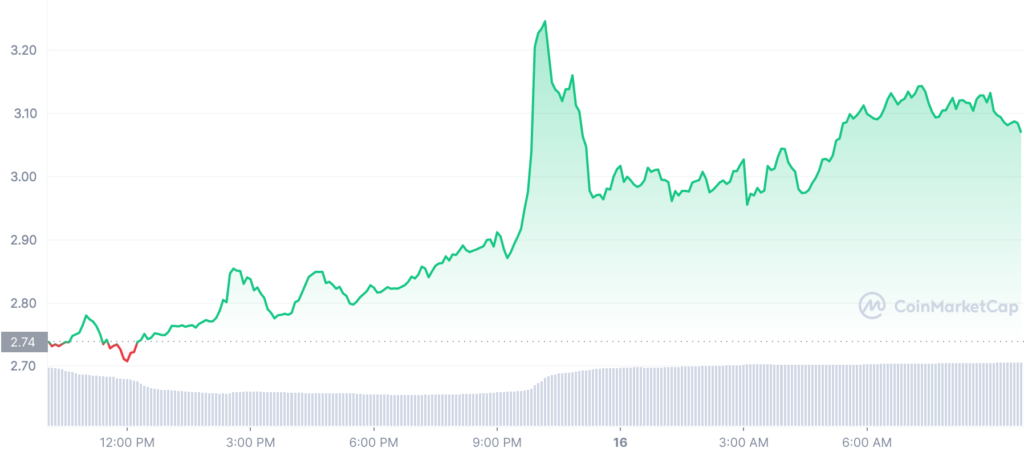
A bullish trend has dominated the HNT charts for the previous 24 hours, according to Helium analysis. The coin’s price has significantly increased as it is now trading at $3.10, up by 13.25% just in the last day.
Today’s market indicators are positive, and Helium (HNT) is not an exception to this bullishness. The market capitalization of Helium (HNT) surged by 13.89% to $428,374,351 and the 24-hour trading volume rose by 21.57% to $9,953,076; both factors helped the growth. The market’s strong performance is a result of its positive attitude and plenty of liquidity.
Bulls are in full control of the HNT market as they are driving the prices higher aiming to breach at the current resistance level ($3.2). If this bullish pressure continues HNT will breach this resistance level and sway up more higher in the coming days.
HNT has been on a bullish outburst for the past week as the bulls have maintained the positive momentum a week setting up new resistance and support levels in different trading sessions along the week. This indicates that HNT has full potential for a continued upswing in the coming days.
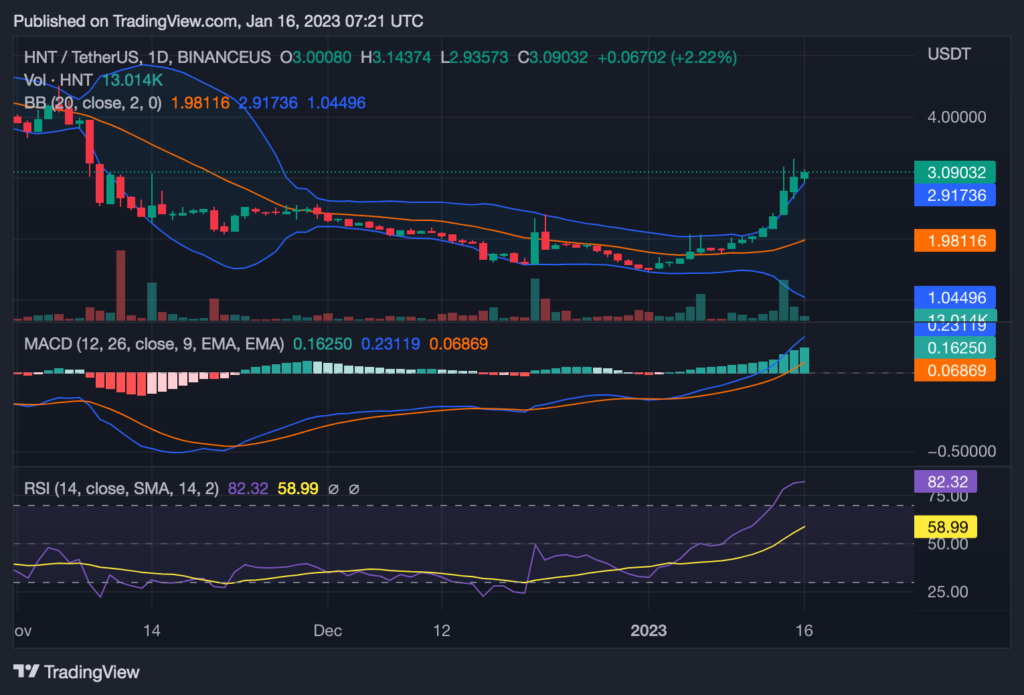
The bullish outburst can be seen exhibited by HNT prices trading above the upper Bollinger band. This indicates that a sway of prices has happened. Additionally, prices may consolidate slightly at these levels before another breach, according to the relative strength indicator (RSI), which is currently at 82.32 and is progressively in the overbought region.
The MACD line (blue) is advancing northward and above the signal line, indicating that the bullish advance in the HNT market will continue because the bullish momentum is very strong. The upward trend of this MACD line and its movement toward the positive area indicate that the Helium market will continue to be dominated by bulls.
The more the histogram moves into the green area, the more likely it is that this bullish forecast will come true.
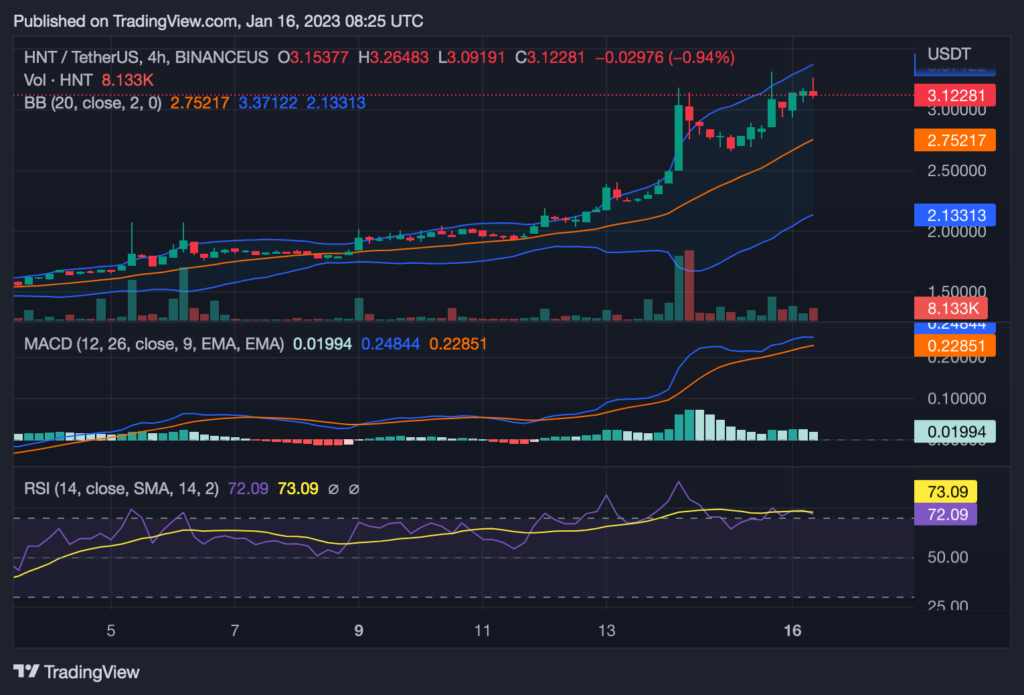
On the four hour chart the bears have started to gamble their way into the HNT market to restrict the continued bullish trend. The buyers therefore should stay in hold of the market to avoid a reversal due to bear pressure.
Buyers are more certain that the Helium market will keep rising after receiving a “buy” signal from the technical rating indicators on the HNT price chart therefore a more bullish trend is expected to continue.
Disclaimer: The views and opinions, as well as all the information shared in this price analysis, are published in good faith. Readers must do their own research and due diligence. Any action taken by the reader is strictly at their own risk, Coin Edition and its affiliates will not be held liable for any direct or indirect damage or loss
Disclaimer: The information presented in this article is for informational and educational purposes only. The article does not constitute financial advice or advice of any kind. Coin Edition is not responsible for any losses incurred as a result of the utilization of content, products, or services mentioned. Readers are advised to exercise caution before taking any action related to the company.

: What Happens If You Use an Unlicensed Platform?")


