


- Bears remain in control of the MATIC market; are bulls tiring?
- MATIC prices have lost 5.47% of their accrued value in the last 24 hours.
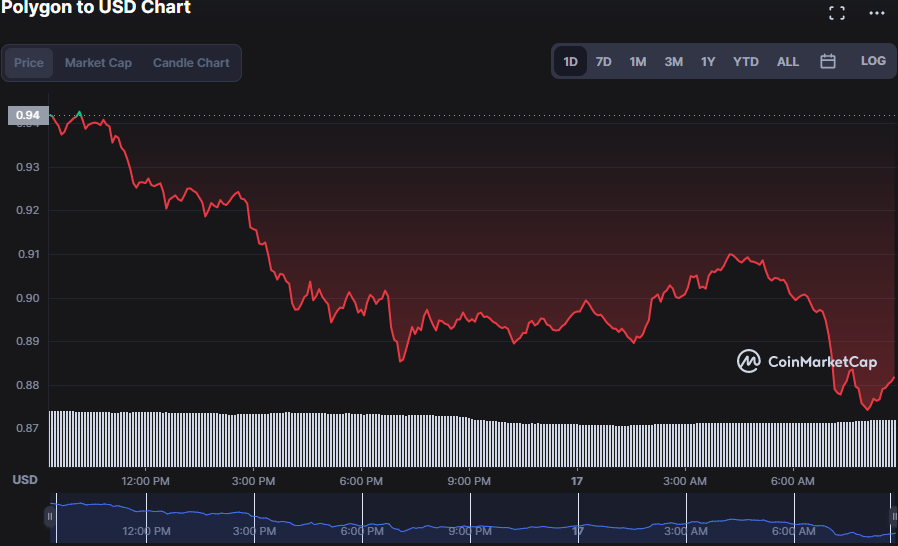
- MATIC has found support at $0.872 and resistance at $0.9427.
Polygon (MATIC) has been subjected to bear control in the last 24 hours, with a 5.47% drop. The digital currency was trading at $0.889 at the time of publishing.
This negative trend is bolstered by a 6.21% drop in its market capitalization to $7,718,708,825 and a 16.33% knock in its 24-hour trading volume to $511,846,729.
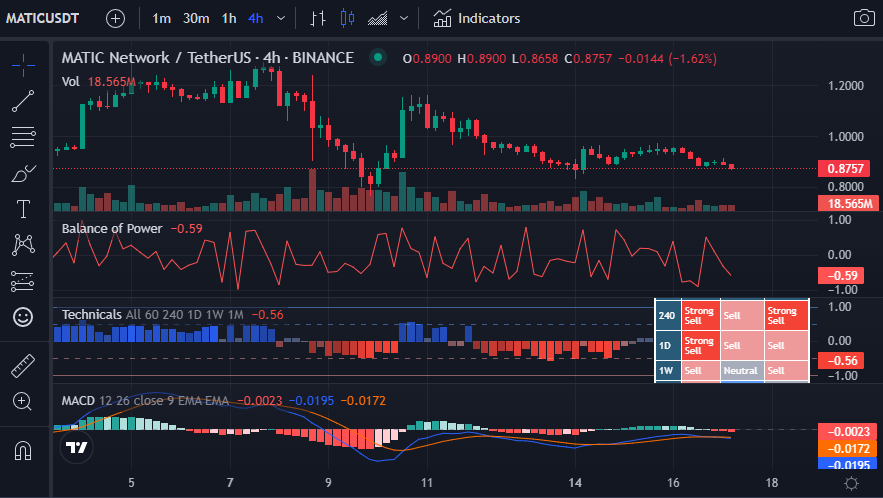
The Technical Rating indicator attests that seller pressure increases in the MATIC market, which exhibits an order for a short position when a “Strong Sell” signal appears on the 4-hour price chart with a reading of -0.56.
A selloff with a falling BOP line indicates more bear dominance, and because a cross-over below the “0” emits a sales signal, bear control in MATIC is imminent. This notion is supported by its declining trajectory, which indicates that sellers will prevail. However, As seen on the 4-hour price chart with the BOP reading at -0.59, a reading near the zero line indicates that the two are in balance and can signal a turnaround.
With a reading of -0.0195, the Moving Average Convergence Divergence (MACD) moves below the signal line and into the negative region, bolstering the current trend’s persistence.
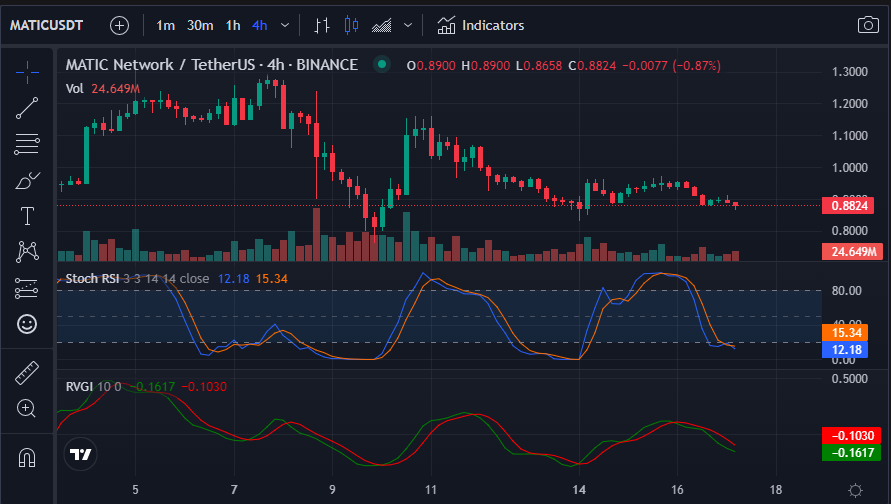
MATIC/USD 4-hour price chart (Source: CoinMarketCap)The Relative Volatility Index (RVI) bearishly crosses into the negative region and below the signal line with a reading of -0.1648 (nearing -0.4), indicating that the market is approaching oversold levels hence bearish dominance.
A Stoch RSI reading of 12.43 denotes that the MATIC market is oversold, and a turnaround may be on the way, as at this level the Stoch RSI indicates that the previous trend is nearing its end. However, it does not indicate the price revision is imminent.
In summary, the bulls must hold the resistance level and jack up prices in order to reverse the declining trajectory of the MATIC trading pattern.
Disclaimer: The views and opinions, as well as all the information shared in this price analysis, are published in good faith. Readers must do their own research and due diligence. Any action taken by the reader is strictly at their own risk, Coin Edition and its affiliates will not be held liable for any direct or indirect damage or loss.
Disclaimer: The information presented in this article is for informational and educational purposes only. The article does not constitute financial advice or advice of any kind. Coin Edition is not responsible for any losses incurred as a result of the utilization of content, products, or services mentioned. Readers are advised to exercise caution before taking any action related to the company.
 Price Prediction 2026-2030: Will TRX Hit $0.50 Soon?")
 Price Prediction 2026-2050: Will HYPE Hit $100 Soon?")


: What Happens If You Use an Unlicensed Platform?")