


 Skyrockets by 29.74%, the Sky is the Limit")
- LTC is expected to continue to dominate in the short term, according to indicators.
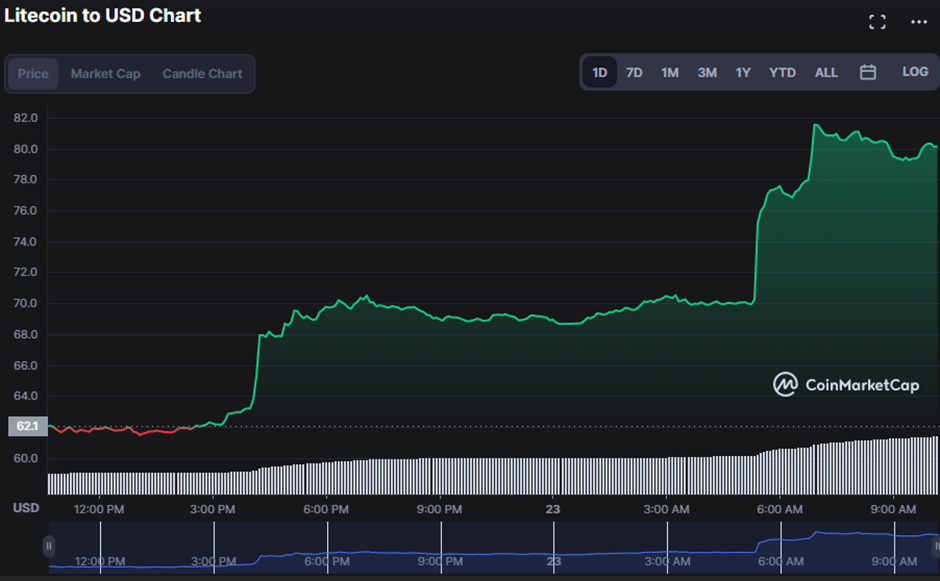
- During the uptrend, LTC finds support at $61.44 and resistance at $81.56.
- On the last day, the price of Litecoin (LTC) had risen to $78.71.
Over the past day, Litecoin’s (LTC) price has soared, fluctuating between support and resistance levels of $61.44 and $81.56. The bulls’ efforts resulted in the LTC price rising during the upswing by 29.74% to $79.99.
This bullish dominance is supported by a 28.28% increase in market capitalization to $5,679,393,139 and a 185.04% increase in 24-hour trading volume to $2,094,709,757.
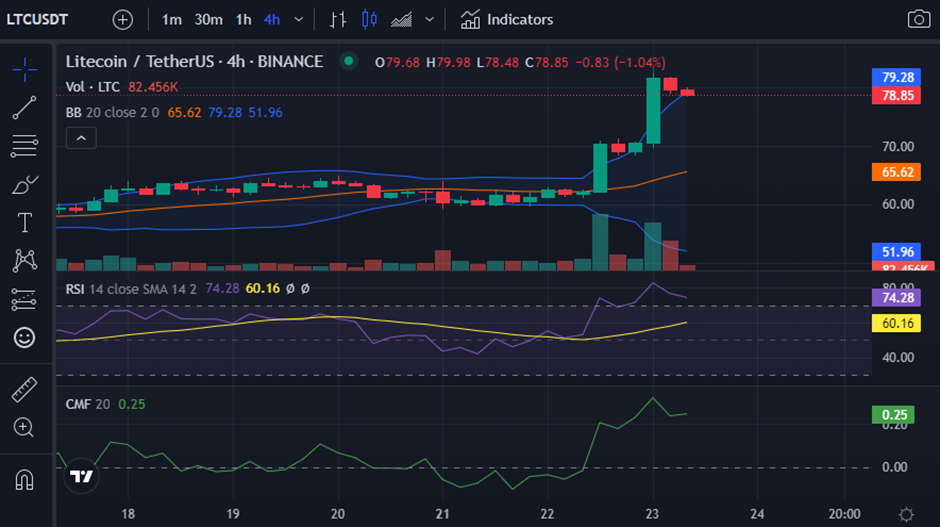
On the 4-hour price chart, the Bollinger Bands are protruding, with the upper band touching 79.22 and the lower band touching 51.99. Increased market volatility is indicated by the BB movement, which is a bullish pattern. Price alterations in the direction of the upper band support this bullish trend in the LTC market.
The LTC market has seen a tremendous increase, as evidenced by the Relative Strength Index (RSI) reading of 74.09, which is approaching the overbought zone. On the other hand, the RSI pointing south suggests that the current trend will continue because it is moving away from the overbought region.
As the Chaikin Money Flow (CMF) rised above the “0” line and reached 0.25, a positive trend is expected to continue, as seen on the LTC 4-hour price chart.
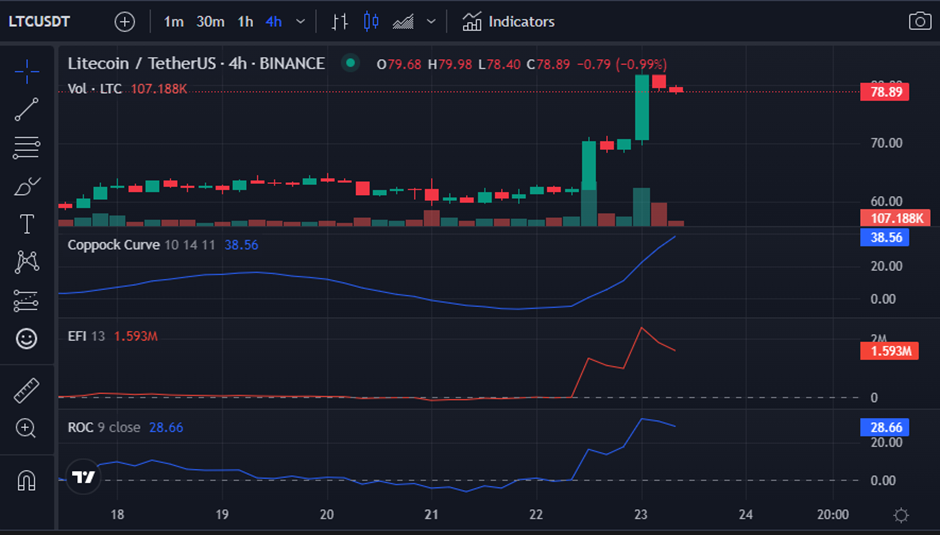
With a reading of 38.44, the Coppock Curve is trending north and positive. This movement validates the price increase in LTC, which is trending north, insinuating persistence.
Furthermore, movement of the Elder Force Index (EFI) and Rate of Change (ROC) above the “0” line, with readings of 1.593M and 28.69, respectively, points to this uptick. Their southward pointing, on the other hand, cautions traders to be watchful in the future.
The bulls have taken over the LTC market, and technical indicators show that bulls are still fighting to keep the market on an upward trajectory.
Disclaimer: The views and opinions, as well as all the information shared in this price analysis, are published in good faith. Readers must do their own research and due diligence. Any action taken by the reader is strictly at their own risk, Coin Edition and its affiliates will not be held liable for any direct or indirect damage or loss
Disclaimer: The information presented in this article is for informational and educational purposes only. The article does not constitute financial advice or advice of any kind. Coin Edition is not responsible for any losses incurred as a result of the utilization of content, products, or services mentioned. Readers are advised to exercise caution before taking any action related to the company.


 Price Prediction: Can BTW Sustain Its Breakout Above $0.1032?")

