


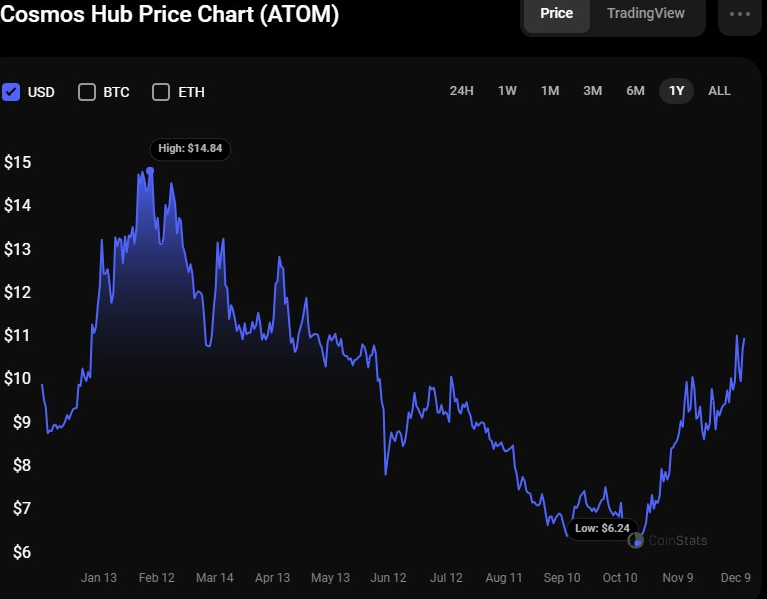
- Cosmos (ATOM) soars to a 6-month high of $12.31, signaling strong bullish momentum.
- Rising market capitalization and trading volume reflect growing investor interest in ATOM.
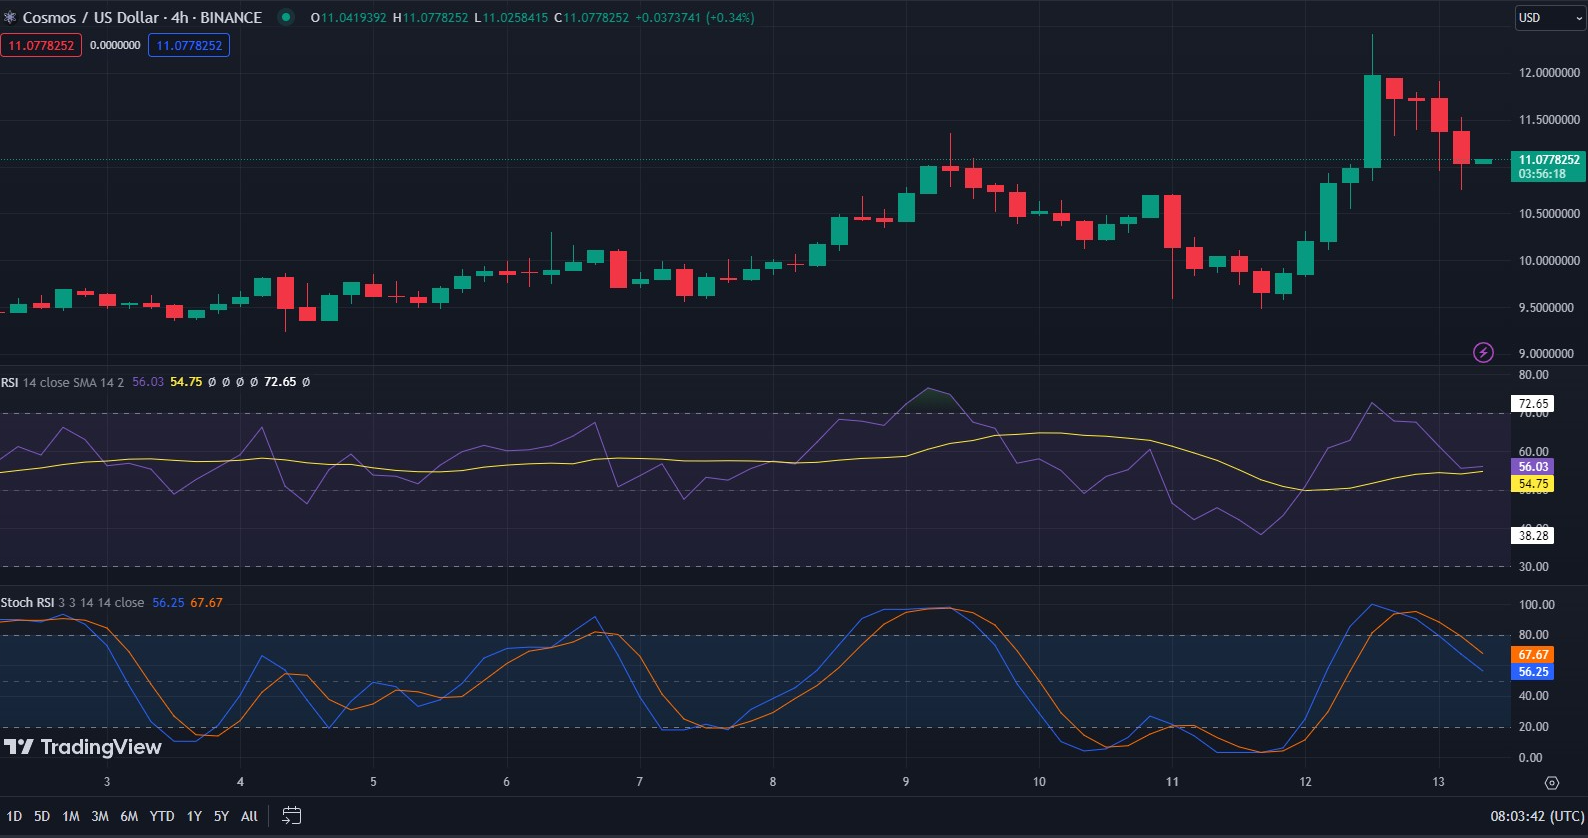
- Indicators signal potential trend shifts as RSI and stochastic RSI hint at market neutrality and possible downside risk for ATOM.
The Cosmos (ATOM) market has experienced a rise in the previous 24 hours, with bulls driving prices up from an intraday low of $10.59 to a 6-month high of $12.31. At press time, ATOM was exchanging hands at $11.01, a 3.69% increase over the previous day’s closing price.
If the really breaks beyond the intraday high of $12.31, the following resistance levels to watch are around $12.50 and $13.00. This bullish trend implies intense market purchasing pressure and suggests investors are bullish on Cosmos’s (ATOM) prospects.
ATOM’s market capitalization and 24-hour trading volume increased by 3.30% and 223.26%, to $4,162,941,526 and $780,257,073, respectively. This huge market capitalization and trading volume growth demonstrates increased investor interest in Cosmos (ATOM). The increased trading volume also implies a high market liquidity level, making it easier for investors to purchase and sell ATOM tokens.
The Relative Strength Index (RSI) on the 4-hour ATOMUSD price chart is trending southwards at 56.28, indicating that the Cosmos (ATOM) market is now neutral. This trend suggests no a relative balance between buying and selling pressure, and the price may continue to consolidate soon. However, if the RSI falls below signal line 50, it could imply a probable negative trend for ATOM.
In addition, the stochastic RSI is moving below its signal line with a rating of 67.57, indicating increased selling pressure and supporting the likely trend shift. Traders may want to be cautious, consider the likelihood of a negative market reversal for Cosmos (ATOM), and use stop-loss orders to safeguard their positions. If the stochastic RSI goes below 50, it will reinforce the negative mood and might lead to a more dramatic drop in the price of ATOM.
In conclusion, Cosmos (ATOM) showcases a bullish surge, but caution is advised as technical indicators suggest a potential market reversal ahead.
Disclaimer: The information presented in this article is for informational and educational purposes only. The article does not constitute financial advice or advice of any kind. Coin Edition is not responsible for any losses incurred as a result of the utilization of content, products, or services mentioned. Readers are advised to exercise caution before taking any action related to the company.


