
- Helius Labs Co-founder claims Solana is addressing the long-standing criticism regarding manual human intervention during network issues.
- “A new change is in the works that automates this,” says Mert Mumtaz.
- Suffering from a week-long negative trend, SOL is trading at $20.62.
Mert Mumtaz, the co-founder of Helius Labs, took to Twitter earlier today to claim that Solana was addressing the long-standing criticism regarding manual human intervention during network issues. “A new change is in the works that automates this,” he said, while also asking his followers to weigh in on the idea.
Mumtaz reminded Twitterati that Ethereum took years to get to where it is today and that it was no different for Solana. Most of his followers welcomed the idea; one user was quoted saying: “Solana will end up the best blockchain out there because of the outages, not in spite of them. Chewing glass is accepting failure, picking yourself up, and saying, ‘I can do better.’ And then proving it. PRs like this prove it.”
With a market cap of $8,159,578,676 and a trading volume of $271,416,935, Solana is positioned in the ninth spot in CoinMarketCap’s top coins by market cap list. Valued at $20.62, Solana has dipped 1.01% in the last 24 hours and 0.40% in the last week. SOL has also weakened against BTC by 0.5%.
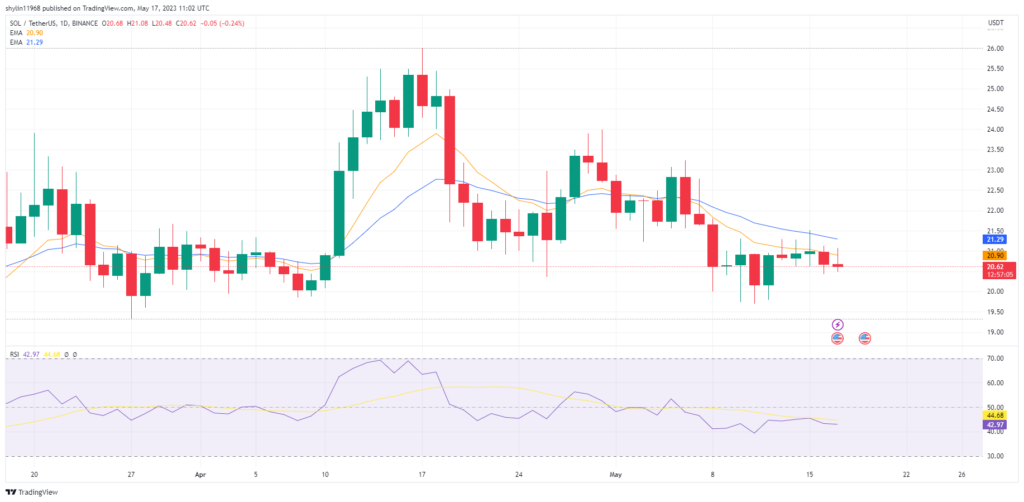
Daily Chart of SOL/USDT (Source: TradingView)
From the daily chart, it is evident that SOL is trading bearishly below the 9 and 20 EMA, which may be a sign that it will drop further in the next 24-48 hours. The RSI indicator on the daily chart supports this bearish thesis, with the RSI line positioned slightly below the RSI SMA line. With a value of 42.7, it is also very close to the oversold region.
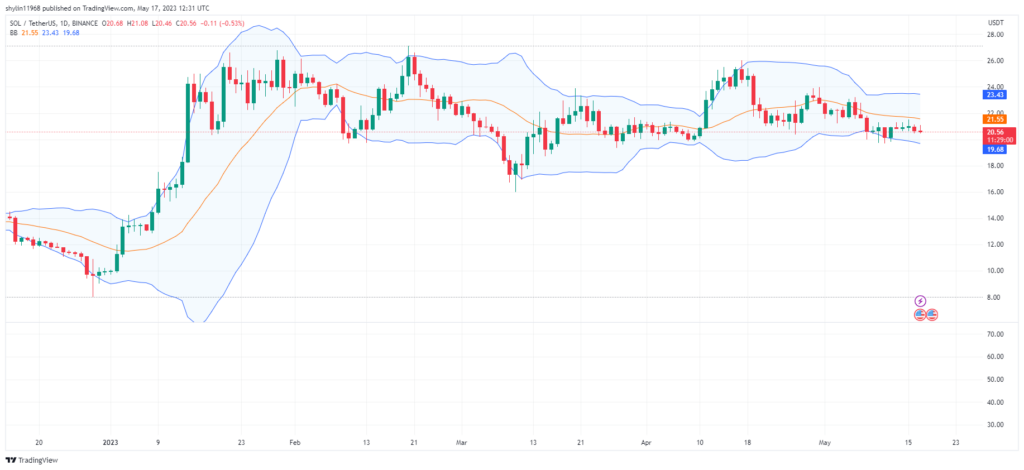
Daily Chart of SOL/USDT (Source: TradingView)
The Bollinger bands on Solana’s chart show that there have not been significant fluctuations in its price and that it has been moving sideways for the past few months, since its considerable jump back in early January. Looking at the current movements, it can be estimated that the price might rise above the SMA line and hit the upper band.
Disclaimer: The views and opinions, as well as all the information shared in this price prediction, are published in good faith. Readers must do their research and due diligence. Any action taken by the reader is strictly at their own risk. Coin Edition and its affiliates will not be held liable for any direct or indirect damage or loss.
Disclaimer: The information presented in this article is for informational and educational purposes only. The article does not constitute financial advice or advice of any kind. Coin Edition is not responsible for any losses incurred as a result of the utilization of content, products, or services mentioned. Readers are advised to exercise caution before taking any action related to the company.
")


