


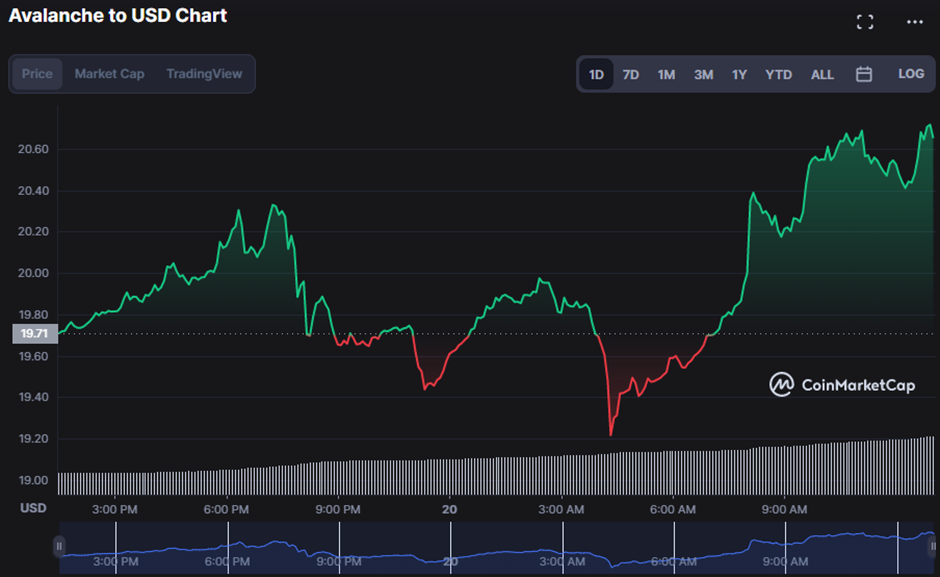
- Bulls flood after finding support around $19.22, propelling AVAX to a 7-day high.
- According to the indicators, the AVAX market may be optimistic.
- AVAX’s price rises by more than 5% due to bullish control.
The Avalance (AVAX) market began the reading session valued at $19.71. Still, bullishness failed in the middle of the day, producing a recession that gave way to bearish dominance, resulting in a slide to an intra-day low of $19.22. Conversely, Bulls ended the bear rule by swooping in and driving the price to a new week high of $20.72. When writing, the AVAX price had risen by 4.41% to $20.61, indicating that bullish momentum was still present.
Traders’ expectations of a long bull run drove up market capitalization and 24-hour trading volume by 4.44% and 127.26%, respectively, to $6,499,612,483 and $442,982,484. The spectacular jump in AVAX price is linked to traders’ anticipation for a lengthy bull run, notably, since it soared from an intra-day low of $19.22 to a new week high of $20.72.
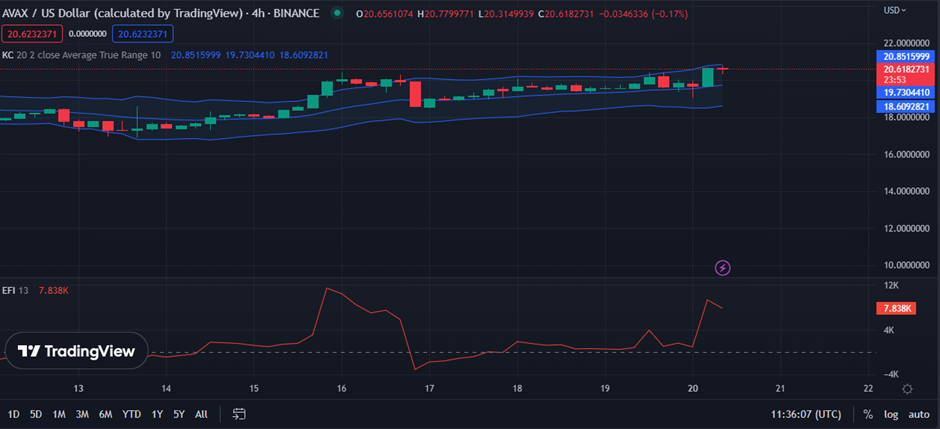
Since the Keltner bands are linearly growing to the north, with the upper band at $20.8541167 and the lower band at $18.6101997, the bullish momentum is expected to persist in the medium term as long as the price remains within these ranges.
As the price action approaches the upper band, traders and investors should consider taking gains since the market will likely become overbought, which may result in a price pullback. As a result, it’s worth considering the possibility of selling at the top of the Keltner band as a trading strategy and then buying back in at a lower price when the market corrects.
With an Elder Force Index of 8.21K, it’s clear that bulls control the market so long as prices stay above the lower Keltner band. By taking advantage of rising prices while hedging against a possible reversal, this strategy can generate substantial profits for traders and investors.
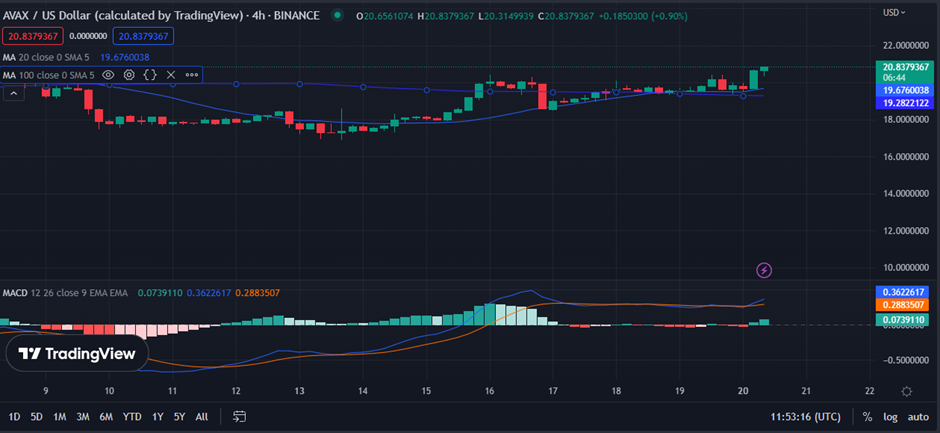
In the AVAX price chart, a golden cross emerges as the 20-day MA crosses over the 100-day MA at 19.6684996 and 19.2809177, respectively. This movement offers a strong buy signal and indicates that the AVAX price will likely rise in the coming hours. The price action climbs above both MAs adding to this optimistic outlook, forming a green candlestick pattern that confirms the bullish signal, signaling that the AVAX price is rising.
The Moving Average Convergence Divergence (MACD) goes above the signal line with a value of 0.3544949, confirming the existence of bullish momentum and giving additional confirmation of the bullish view. Also, the histogram is reading in positive territory and increasing, suggesting the presence of purchasing pressure. This strong buying signal, the green candlestick pattern, and the positive MACD reading point to a gain in AVAX price soon.
Technical indicators suggest the AVAX market’s upward trend may persist if the bull reigns.
Disclaimer: The views and opinions, as well as all the information shared in this price prediction, are published in good faith. Readers must do their research and due diligence. Any action taken by the reader is strictly at their own risk. Coin Edition and its affiliates will not be held liable for any direct or indirect damage or loss.
Disclaimer: The information presented in this article is for informational and educational purposes only. The article does not constitute financial advice or advice of any kind. Coin Edition is not responsible for any losses incurred as a result of the utilization of content, products, or services mentioned. Readers are advised to exercise caution before taking any action related to the company.


