


- AXS price surges to a 30-day high, driven by bullish sentiment and rising buying pressure.
- MACD and MFI indicators support a continued AXS price rise, but RSI signals caution.
- ROC suggests a momentum decline, warning traders to stay vigilant for possible trend reversal.
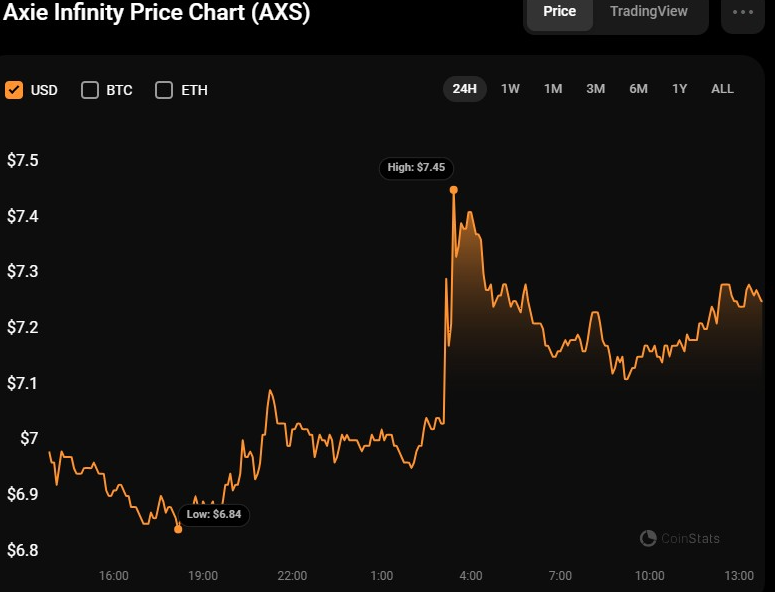
Despite a bearish start in the Axie Infinity (AXS) in the early hours, bulls recovered after establishing support at the intra-day low of $6.83. Consequently, the AXS price rose to a 30-day high of $7.44 before falling slightly. However, as of press time, AXS was still trading at $7.26, a 3.79% increase from the intraday low.
This rising surge can be ascribed to positive market sentiment and increasing buying pressure from investors. AXS’s market capitalization and 24-hour trading volume increased by 3.87% and 19.08%, respectively, to $958,539,422 and $170,693,642, demonstrating this optimism.
Concurrently, if the bullish trend breaks through the $7.44 resistance, the next level to watch for is around $7.80, a solid resistance level for AXS. However, if the price fails to break over the $7.44 resistance level, a possible retracement might ensue, with the support level to watch for being around $6.90.
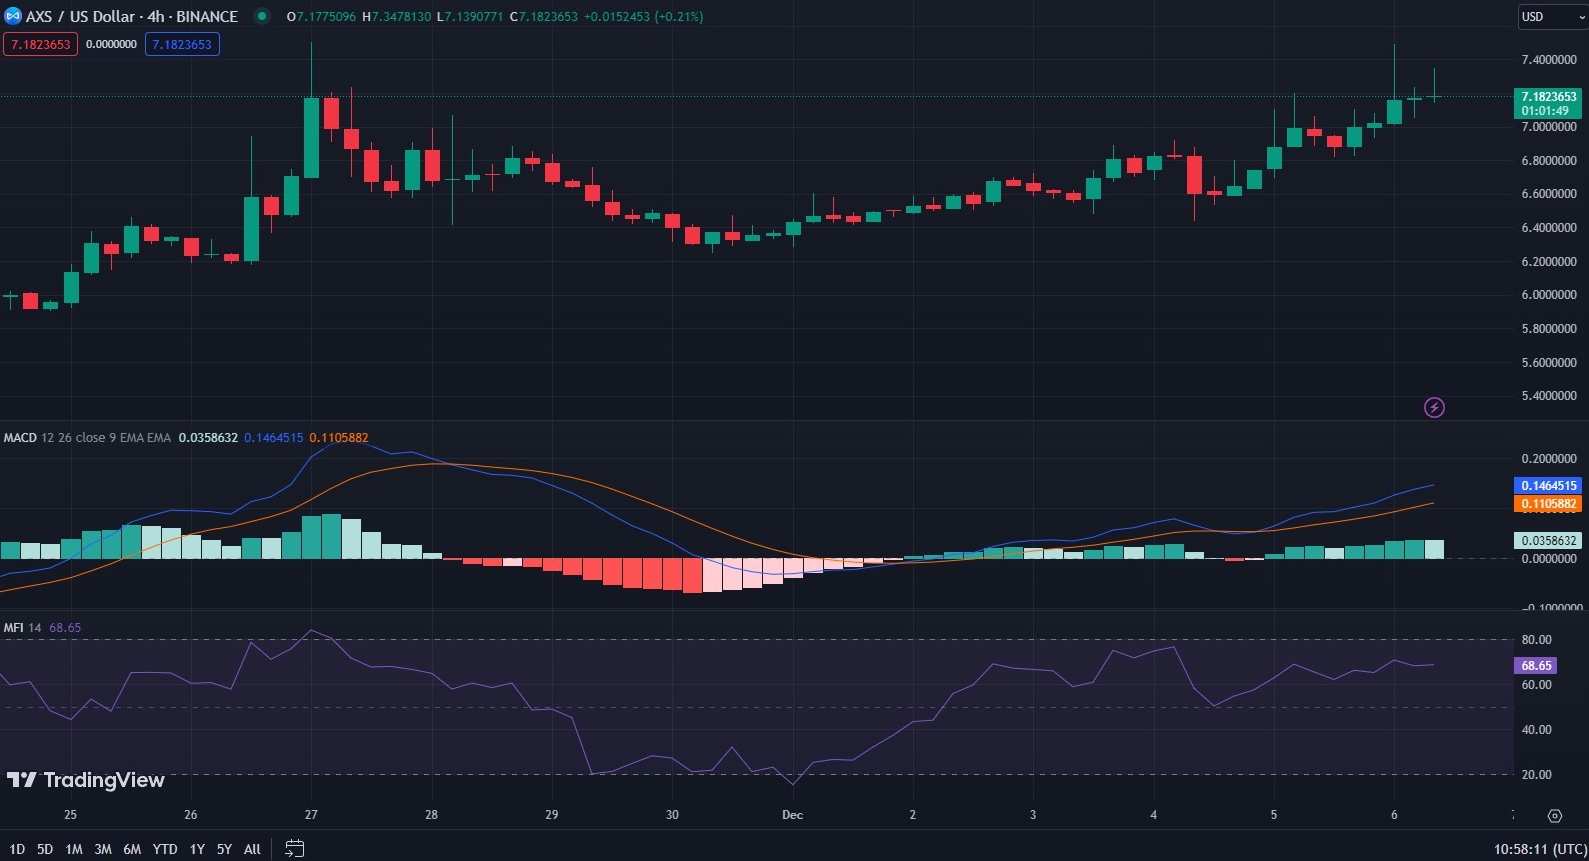
The Moving Average Convergence Divergence (MACD) on the AXSUSD 4-hour price chart is positive, with a rating of 0.1444775, indicating bullish momentum. This MACD trend suggests that the purchasing demand for AXS is currently stronger than the selling pressure, implying that the price will likely continue to rise.
Furthermore, AXS’s Money Flow Index (MFI) rating of 68.71 supports the positive view. The MFI is over the 50 threshold, suggesting positive money flow into the company, implying that investors are actively purchasing AXS. This positive trend strengthens the possibility that the price will continue to rise. However, if the MFI rises above 70, it may indicate that the stock has become overbought and that a correction is impending.
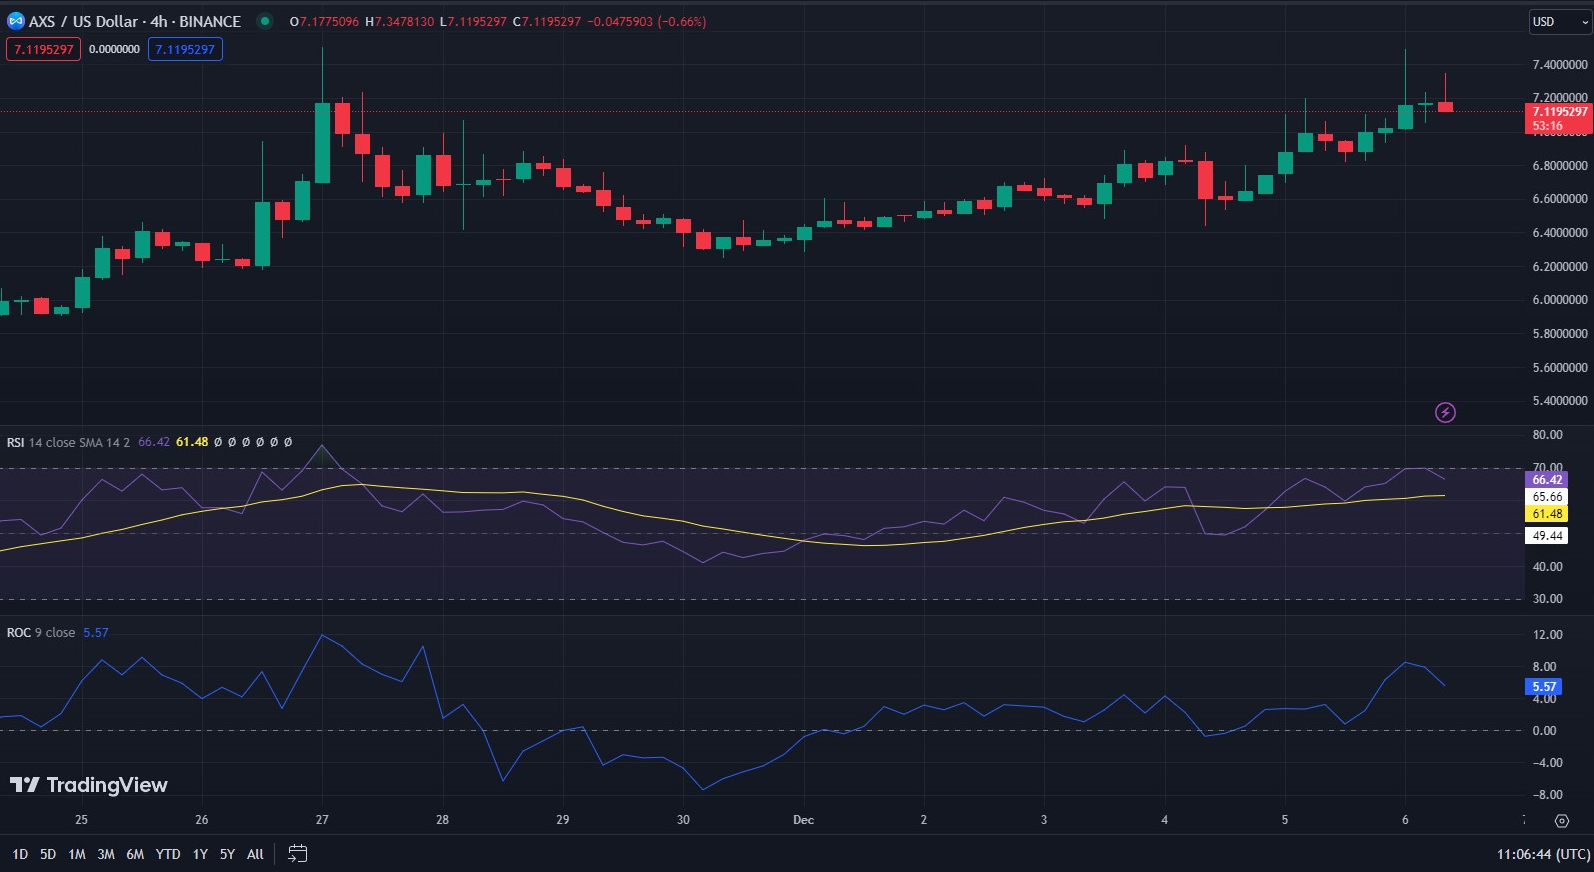
The Relative Strength Index (RSI) which was at 70 also indicates that AXS is currently overbought. As a result, traders ought to consider taking profits or setting a stop-loss strategy to safeguard themselves against a potential slump. However, if the MFI and RSI levels continue to rise, it may signal that the stock is gaining strength. In this instance, traders may consider holding existing holdings and adding to them as the price rises.
With a rating of 6.13, the Rate of Change (ROC) shift southwards implies a reduction in the stock’s momentum. This trend warns traders to be cautious and consider selling positions to avoid potential losses. Furthermore, if the ROC continues to fall, it may indicate a probable trend reversal, underscoring the importance of traders actively monitoring the stock’s performance.
In conclusion, AXS shows promise with bullish indicators, but caution is advised as overbought conditions and momentum decreases hint at potential market shifts.
Disclaimer: The information presented in this article is for informational and educational purposes only. The article does not constitute financial advice or advice of any kind. Coin Edition is not responsible for any losses incurred as a result of the utilization of content, products, or services mentioned. Readers are advised to exercise caution before taking any action related to the company.
 Price Prediction 2026, 2027, 2028, 2029, 2030-2050")


