


 Bulls Eye Potential Reversal")
- ARB faces resistance at $1.42 and finds support at $1.34 during the last day.
- Expanding Bollinger bands suggest a possible reversal in the ARB market.
- Bullish sentiment may be on the horizon for ARB as it touches the lower Bollinger band.
Arbitrum (ARB) market was controlled by bulls in the previous 24 hours until lately encountering resistance at the intra-day high of $1.42. Due to the bull’s inability to break through the resistance level, bears grabbed market control and dropped the ARB price to a 24-hour low of $1.34. ARB was valued at $1.35, a 0.87% decrease from the previous day’s closing price, showing a pessimistic market mood.
During the correction, the market capitalization fell by 0.89% to $1,723,222,739, while the 24-hour trading volume increased by 103.16% to $426,351,599.
This contrast reflects the market’s extreme volatility, with investors immediately selling off their assets during the correction and taking advantage of reduced prices to buy back in and boost trade volume.
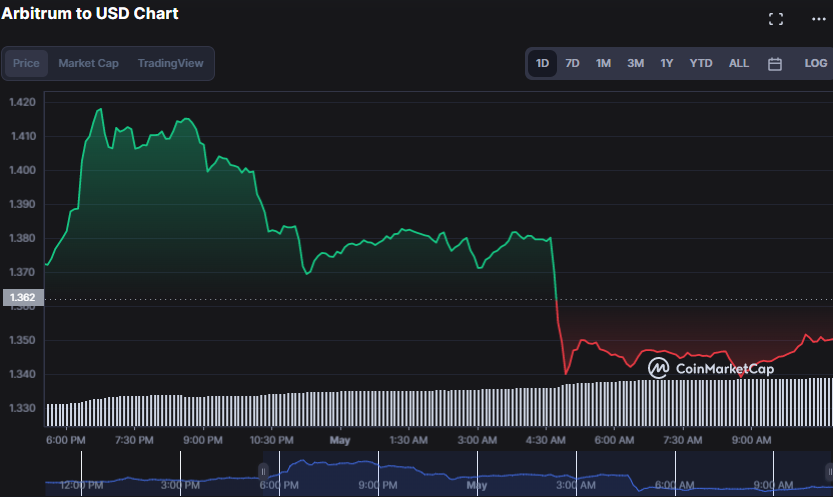
ARB/USD 24-hour price chart (source: CoinMarketCap)
The expanding Bollinger bands on the ARB/USD 4-hour price chart, and rising trade volume imply that the negative momentum is fading and a reversal is possible.
As price action approaches the Simple Moving Average line, the building green massive candlestick indicates that bulls are taking control and buyers are coming in, signaling a likely change in market sentiment towards an optimistic view.
The MACD line is now at -0.05, indicating mild negative momentum in the market, but the forming green candlestick and the possible bullish change in mood suggest that now may be an excellent time to consider buying into the market.
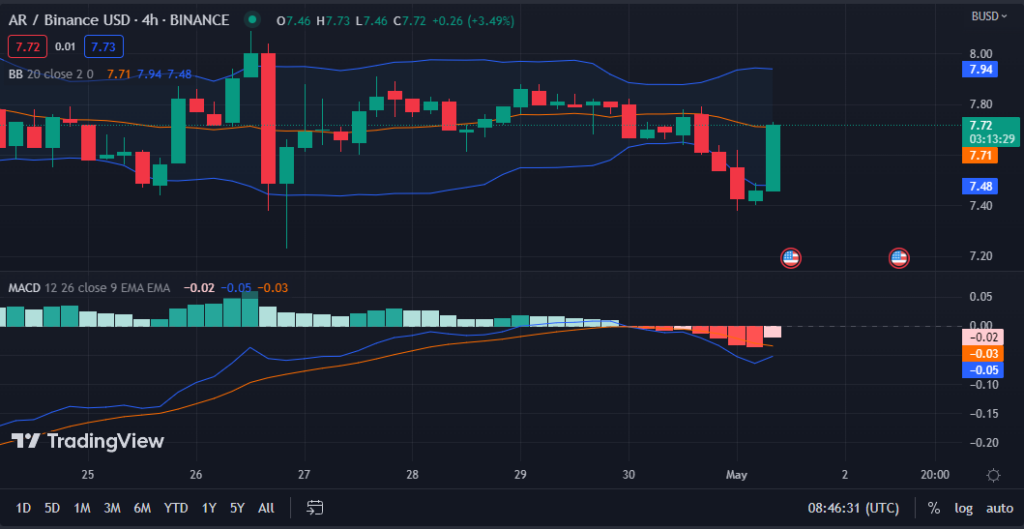
ARB/USD 4-hour chart (source: TradingView)
On the ARB/USD 4-hour price chart, the 100-day MA (orange) reading of 8.16 movement above the 20-day MA (blue) reading of 7.71 indicates that the longer-term trend is more bullish than the short-term trend, which could mean that a potential bullish sentiment may be impending for ARB.
This movement shows that traders could consider purchasing ARB/USD at current prices to capitalize on possible positive sentiment.
The price action below both moving averages shows that the bears are in control. However, the bear reign could be ending, as ARB is testing the 20-day MA. This price action close to the 20-day MA could boosts an optimistic mood among traders and investors to join the market by buying the dip to profit from future gains.
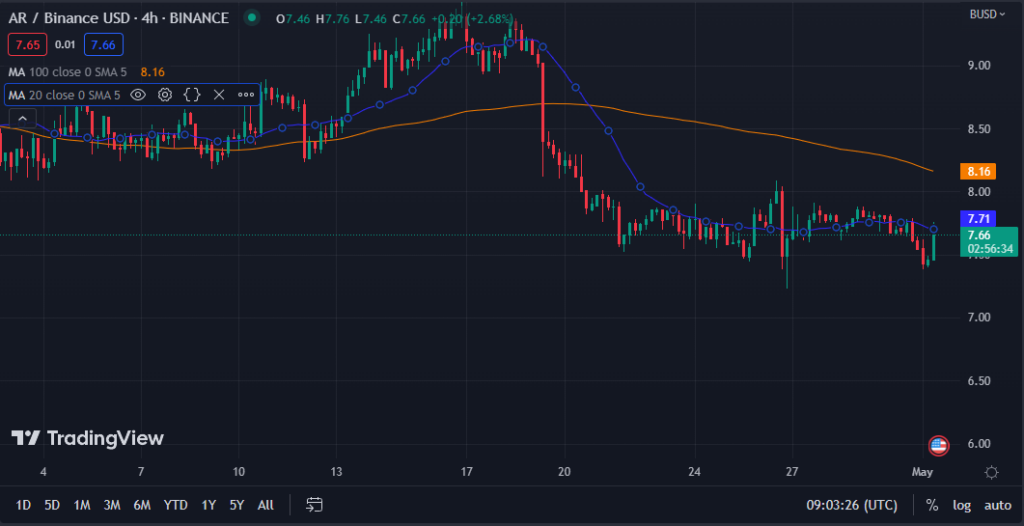
ARB/USD chart (source: TradingView)
In conclusion, ARB’s market is currently experiencing a slightly bearish trend, but the signs of a potential trend reversal and bullish sentiment indicate that now may be a good time for traders to buy in and profit from future gains.
Disclaimer: The views, opinions, and information shared in this price prediction are published in good faith. Readers must do their research and due diligence. Any action taken by the reader is strictly at their own risk. Coin Edition and its affiliates will not be liable for direct or indirect damage or loss
Disclaimer: The information presented in this article is for informational and educational purposes only. The article does not constitute financial advice or advice of any kind. Coin Edition is not responsible for any losses incurred as a result of the utilization of content, products, or services mentioned. Readers are advised to exercise caution before taking any action related to the company.


