


- 1INCH market sees prolonged bearishness, potential buying opportunity ahead.
- Traders should watch out for critical support levels to prevent further price loss.
- Negative trend continues in the 1INCH market, caution advised for investors.
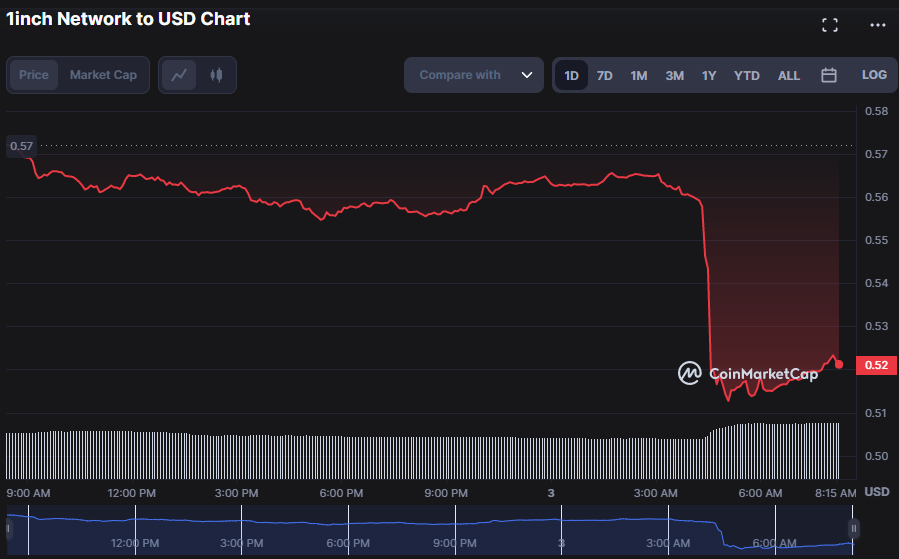
Negative sentiment dominated the 1inch Network (1INCH) market during the previous day, while bullish attempts to recapture the market was met with resistance at the intraday high of $0.5734. In reaction to the bears’ domination, the 1INCH market fell to a 7-day low of $0.5127, where it found support.
As a consequence of this prolonged bearishness, 1INCH is presently trading at $0.5218, down 8.94% from its intraday high.
Market capitalization declined by 8.99% to $433,004,141, but 24-hour trading volume increased by 20.33% to $37,231,587, indicating that investors are taking advantage of the drop to purchase 1INCH at a cheaper price point. It remains to be seen, however, if this heightened buying pressure would be sufficient to reverse the negative trend.
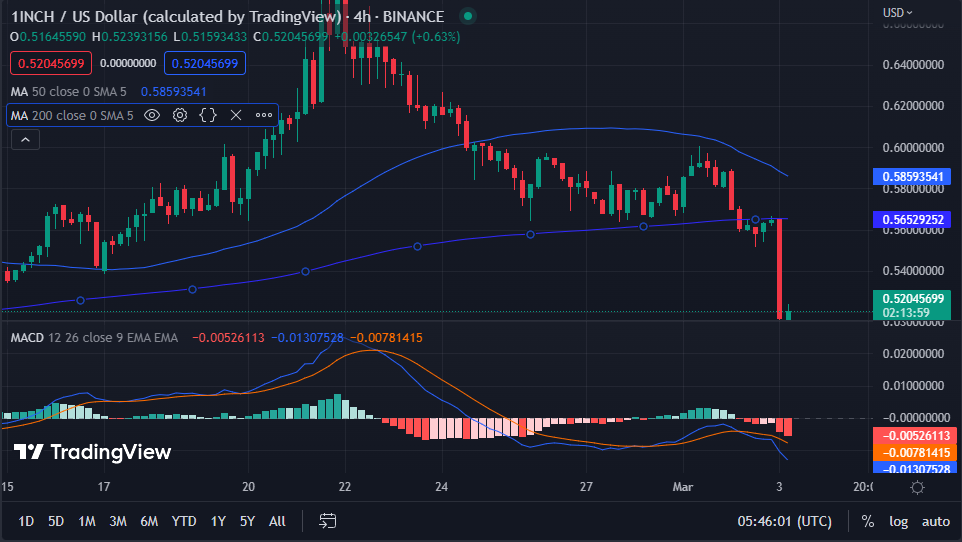
On the 1INCH market, the 50-day MA crosses above the 200-day MA, indicating that, although the market is adverse, it may change from a bearish to a bullish trend, perhaps signaling a buying opportunity. The 50-day moving average is now at 0.58593541, while the 100-day MA is at 0.56524452, indicating the current direction. This motion suggests that the market will likely see an increase soon, which might provide an excellent opportunity for investors.
Nevertheless, since price action is moving below the moving averages, investors should be mindful of the possible hazards of investing in this market and use suitable risk management measures to safeguard their interests.
With a value of -0.01307528, the MACD line has lately moved below its signal line, indicating a negative market trend. So, investors should be careful when making investments and use risk management techniques to reduce the chance of losing money. Furthermore, the histogram moves in the negative zone, indicating that the market will likely continue to be bearish soon, making it critical for investors to be conscious of their risk tolerance.
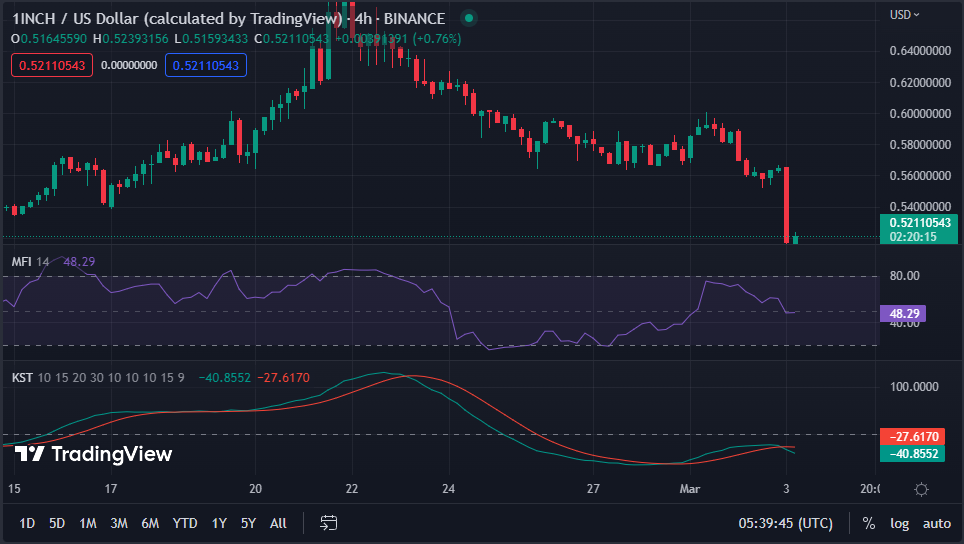
Although the current trend in 1INCH is negative, the Money Flow Index (MFI) reading of 48.40 on the 4-hour price chart indicates that there is still some buying pressure in the market, which might aid to prevent additional bearish movement in the immediate term.
However, traders should keep a watch on critical support levels, as a breach below these levels might prompt more selling pressure and result in a more significant price loss.
The Know Sure Thing (KSI) indicates that the market is now in a bearish trend, with a reading of -41.0737 and moving below the signal line. This movement implies that traders should exercise caution and explore short positions or sell-offs to prevent future losses.
Investors should proceed with caution as 1INCH faces bearish pressure, but the MFI suggests some buying support. Critical support levels must be monitored to avoid further losses.
Disclaimer: The views and opinions, as well as all the information shared in this price prediction, are published in good faith. Readers must do their research and due diligence. Any action taken by the reader is strictly at their own risk. Coin Edition and its affiliates will not be held liable for any direct or indirect damage or loss.
Disclaimer: The information presented in this article is for informational and educational purposes only. The article does not constitute financial advice or advice of any kind. Coin Edition is not responsible for any losses incurred as a result of the utilization of content, products, or services mentioned. Readers are advised to exercise caution before taking any action related to the company.


