


- SHIB price hits its 90-day low while the bears dominate current market sentiment.
- Bullish potential will emerge if SHIB breaks the $0.0000085 resistance level.
- SHIB market capitalization has dropped and presents buying opportunities.
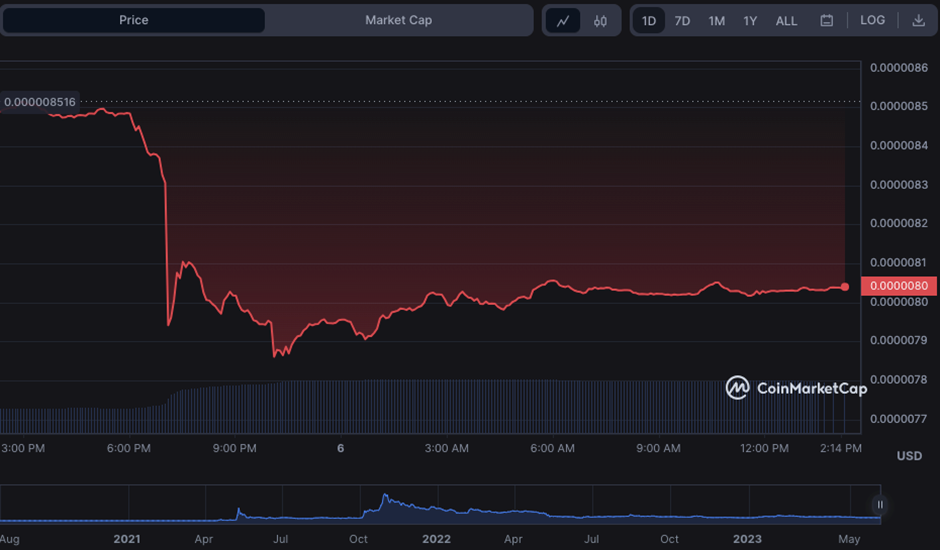
In the previous 24 hours, the Shiba Inu (SHIB) market has seen a significant retracement, with bears lowering the price from an intra-day high of $0.000008527 to a new 90-day low of $0.000007861. As of press time, pessimistic sentiment remained strong, triggering a 5.22% drop to $0.000008038.
If negative momentum breaks through the 24-hour low of $0.000007861, the next level of support to monitor is $0.0000075. However, if bulls can push the price over the present barrier level of $0.0000085, we may witness a short-term advance toward the next resistance level of $0.0000092.
The SHIB’s market capitalization fell by 5.24% to $4,736,924,386 during the decline, while the 24-hour trading volume increased by 104.76% to $152,731,469. This recent drop in SHIB’s market capitalization is a purchasing opportunity for traders who believe in SHIB’s long-term potential.
The Know Sure Thing signal motion in the positive zone shows that the market is bullish, while the movement in the negative territory indicates the market is in a bearish trend.
As a result, the Know Sure Thing (KST) movement in negative territory on the SHIB/USD 4-hour price chart with a reading of -34.1793 indicates that the SHIB/USD market is now in a bearish trend. To be oversold, the KST score should be less than -50, indicating that there is still space for the market to dip lower.
A short-term price rebound is possible with the Relative Strength Index at 31.52 and trending higher. If the RSI rises further, it might indicate a change in market mood and the end of the negative trend.
The Money Flow Index rating 28.75 on the SHIB/USD 4-hour price chart indicates that the market is in a negative trend. This suggests that the selling pressure exceeds the purchasing pressure, and traders should consider taking short positions.
If the Money Flow Index goes below 20, it may suggest an oversold position and a possible buying opportunity.
The SHIB price chart’s technical rating indicator is “strong sell,” indicating a negative current trend. This movement shows that traders should be cautious when contemplating a long position in SHIB.
In conclusion, SHIB faces bearish sentiment as the price hits a 90-day low. Traders should exercise caution amid the negative trend and consider short positions.
Disclaimer: The views, opinions, and information shared in this price prediction are published in good faith. Readers must do their research and due diligence. Any action taken by the reader is strictly at their own risk. Coin Edition and its affiliates will not be liable for direct or indirect damage or loss.
Disclaimer: The information presented in this article is for informational and educational purposes only. The article does not constitute financial advice or advice of any kind. Coin Edition is not responsible for any losses incurred as a result of the utilization of content, products, or services mentioned. Readers are advised to exercise caution before taking any action related to the company.
 Price Prediction 2026-2030: Will TRX Hit $0.50 Soon?")
 Price Prediction 2026-2050: Will HYPE Hit $100 Soon?")


: What Happens If You Use an Unlicensed Platform?")