


- Recent research indicates that bears have been dominating the Shiba Inu (SHIB) market.
- Shorter-term MA crosses above longer-term MA forecasting market correction.
- Intense opposition at $0.000008632 halted bullish efforts to reverse.
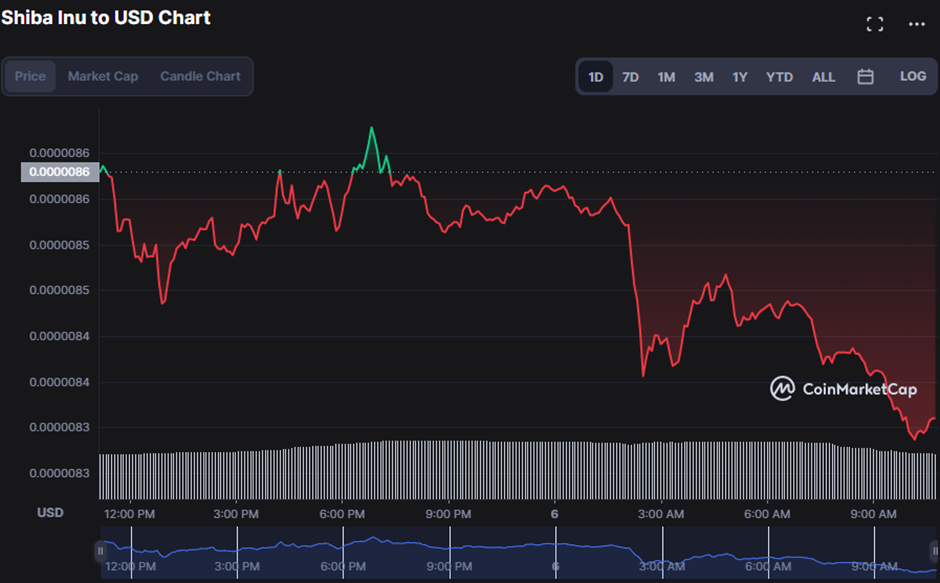
Shiba Inu (SHIB) market prices rapidly rose to $0.000008632 before facing heavy resistance and fell to a session low of $0.000008284, where they ultimately found support. The decline was steady but continuous, indicating that buyers had little inclination to chase the price up.
As the buying pressure increased, the price stabilized at $0.000008350. However, since this upswing had minimal volume, suggesting that purchasers were not highly driven to push the price higher, Shib plummeted to $0.000008294, a 2.24% drop as of press time.
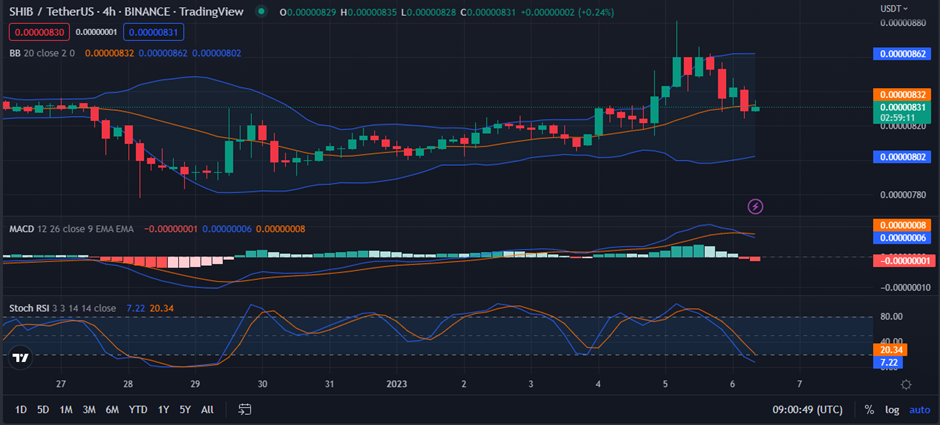
When the stochastic RSI goes below 20, it indicates that the security has been oversold and is about to enter a bullish trend. This move gives investors hope for a favorable rebound while simultaneously serving as a warning. Hence, on the SHIB price chart, a stochastic relative strength index (RSI) value of 7.85 shows that it is overbought, and a bear market is therefore could be forecasted.
Bollinger bands are spreading out, with the upper band at $0.0000862 and a lower band at $0.0000802. This analysis suggests that selling pressure is increasing. Nonetheless, robust selling pressure is anticipated when the SHIB price breaks the lower zone. A market correction may be on the horizon, unless, if bulls step in and the price breaks above the upper band.
At 0.00000006, a negative sentiment is growing as the MACD slows down after crossing below its signal line. This trend shows how pessimism is gaining ground in the market. This pattern, however, suggests that in the current market environment, it may be favorable to participate in short position trades for a rapid profit.
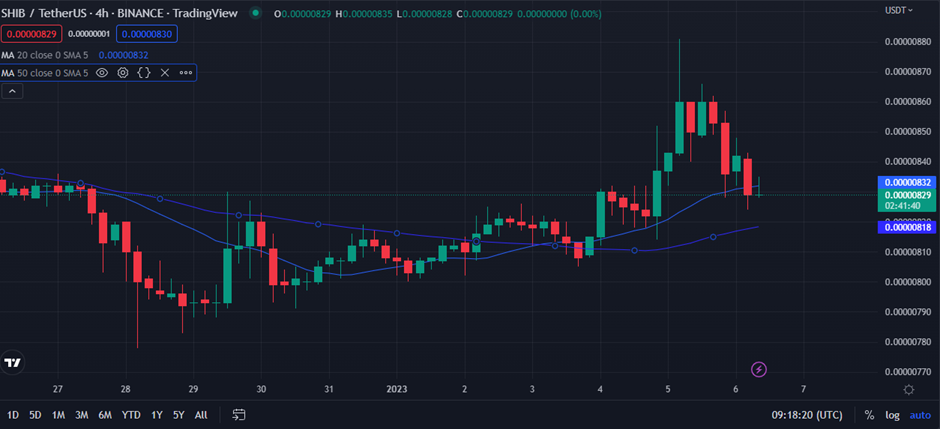
A “golden cross” is generated when the 20-day moving average (0.00000832) climbs above the 50-day moving average (0.00000818), signifying a negative market correction. For some investors, this might ignite a period of excessive confidence and risk-taking, causing the market to correct. As a consequence, safeguarding client portfolios from catastrophic losses requires strict risk management and the use of appropriate stop-loss thresholds.
A reversal of the SHIB market’s current downtrend is possible if bulls rally and successfully drive prices upward.
Disclaimer: The views and opinions, as well as all the information shared in this price analysis, are published in good faith. Readers must do their own research and due diligence. Any action taken by the reader is strictly at their own risk. Coin Edition and its affiliates will not be held liable for any direct or indirect damage or loss.
Disclaimer: The information presented in this article is for informational and educational purposes only. The article does not constitute financial advice or advice of any kind. Coin Edition is not responsible for any losses incurred as a result of the utilization of content, products, or services mentioned. Readers are advised to exercise caution before taking any action related to the company.


