


- ETH trades at $1,651 with RSI at 28.94 and a bullish reversal candle printed at the June low
- Ethereum wallet count hits 195M, just 5M away from 200M despite extreme fear sentiment
- Delta Price model, which called the last two ETH bottoms, currently sits near $700
Ethereum trades at $1,651 on June 11, bouncing 1.96% off the $1,593 low as the daily chart prints a bullish reversal candle at the same level where RSI hit its most oversold reading in months. The problem is one on-chain model that correctly called the last two ETH cycle bottoms now points to $700 as the real floor.
ETH Daily Chart: Reversal Candle Printed But Every EMA Is Still Pointing Down
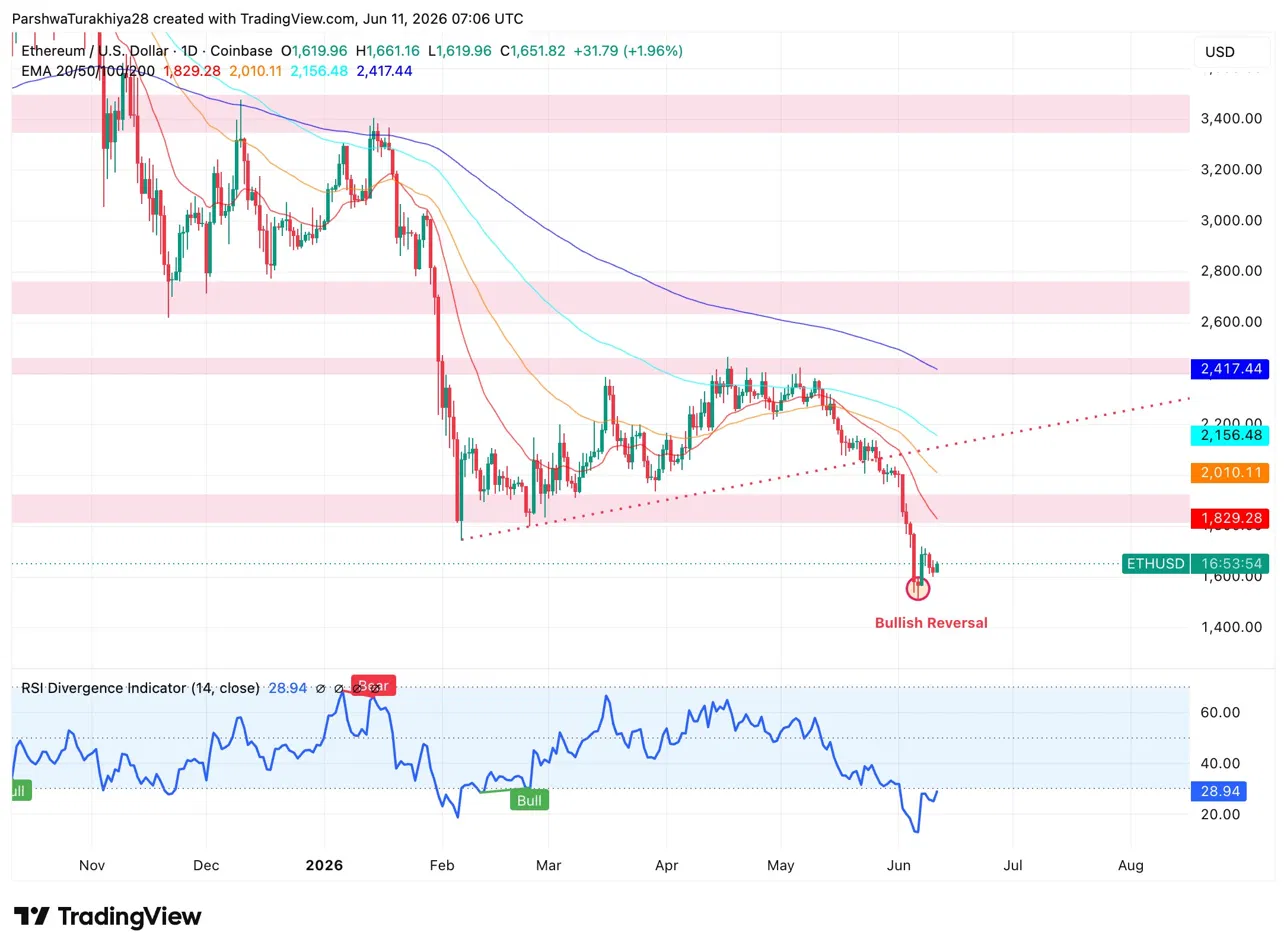
The bullish reversal candle at $1,593 is the first thing bulls can point to in weeks. RSI at 28.94 is recovering from a reading below 20 seen just days ago, which produced the last bullish divergence setup. Each prior time RSI hit this zone on the daily chart, a relief move followed.
All four EMAs remain in bearish order far above price: 20 at $1,829, 50 at $2,010, 100 at $2,156, and 200 at $2,417. Reclaiming $1,829 is the first meaningful test of whether this bounce has conviction. Until that level flips, the trend has not changed.
- Resistance: $1,829 (20 EMA), $2,010 (50 EMA)
- Support: $1,593 (reversal low), $1,500 (next key level)
195 Million Wallets and Still Falling: What the Adoption Data Actually Says
Santiment flagged Ethereum closing in on 200M non-empty wallets, currently sitting at 195M. That number is 230% higher than Bitcoin’s 59M wallet count, a lead that has widened consistently across multiple market cycles. The gap between adoption metrics and price performance has rarely been this wide.
Related: Velvet Price Prediction: Can VELVET Sustain Its Explosive Rally Above $1 After an 885% Surge?
Most of that growth comes from DeFi participation, staking, and active on-chain engagement rather than passive holding. Sentiment data shows extreme fear dominating social media around ETH, yet the wallet count keeps climbing. Markets can stay disconnected from fundamentals far longer than expected, but 195M active wallets approaching a round number milestone is not noise.
ETH Derivatives: Volume Jumped 11% but Liquidations Are Mixed
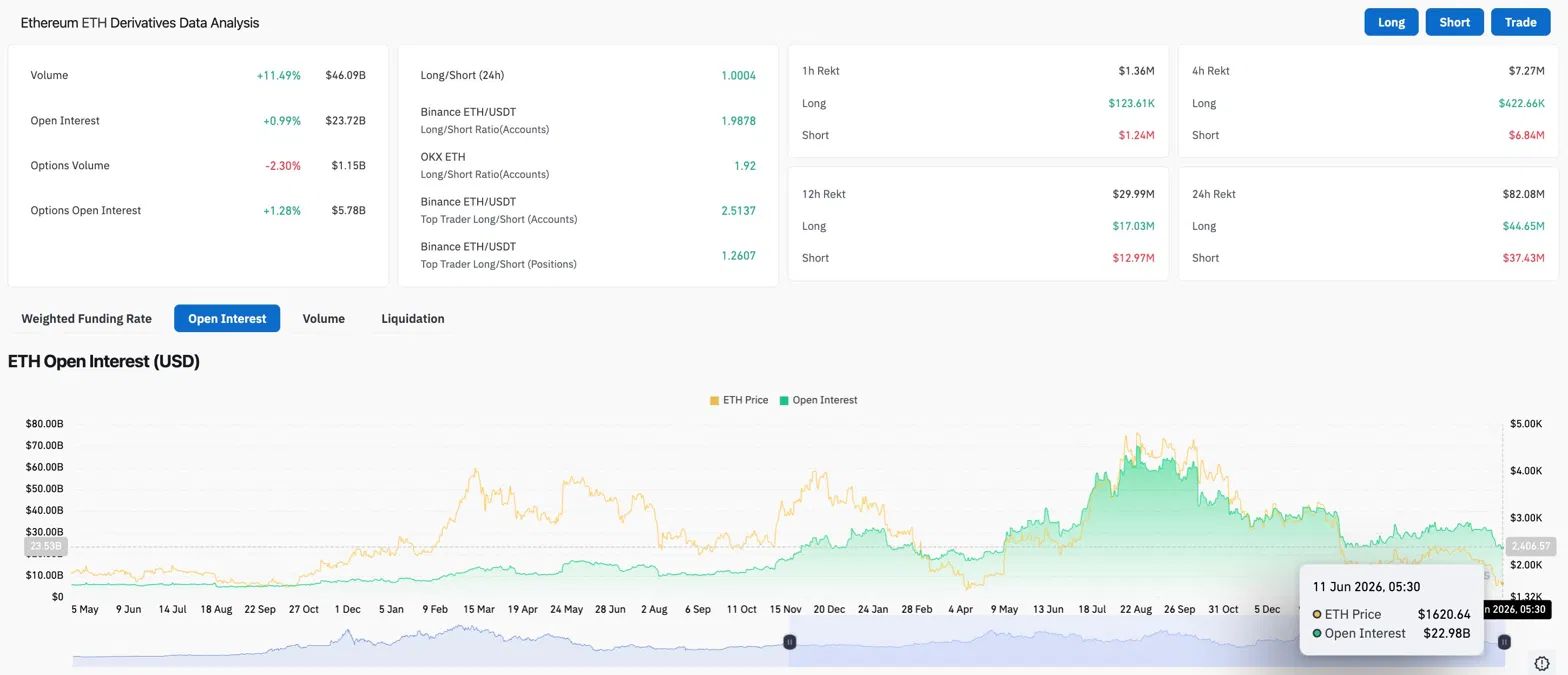
Volume rose 11.49% to $46.09B while open interest edged up 0.99% to $23.72B. Both rising together points to new positions being added with fresh directional intent.
The 24-hour long/short ratio sits at 1.0004, perfectly neutral. Over 24 hours, $44.65M in long liquidations hit against $37.43M on the short side. Neither side is clearly winning the liquidation battle right now.
The $700 Warning No ETH Holder Wants to Read
Analyst Ali Charts flagged that Alphractal’s Delta Price model, which reflects the relationship between investor cost basis and miner production cost, currently sits near $700. The same model identified the last two major ETH cycle bottoms before they reversed. If history holds, ETH could see $700 before the next sustained uptrend begins.
That scenario requires a further 57% drop from current levels. It is not a base case but it is not dismissible either, given ETH has already dropped 68% from its August 2025 peak with no structural support reclaimed.
Ethereum Price Prediction for June 12, 2026
- Upside: A hold above $1,593 and a reclaim of $1,829 targets $2,010. Continued wallet growth crossing 200M would add a narrative catalyst.
- Downside: A close below $1,500 opens the path toward $1,200, with the Delta Price model flagging $700 as a longer-term risk if macro pressure keeps building.
Disclaimer: The information presented in this article is for informational and educational purposes only. The article does not constitute financial advice or advice of any kind. Coin Edition is not responsible for any losses incurred as a result of the utilization of content, products, or services mentioned. Readers are advised to exercise caution before taking any action related to the company.
 Price Prediction 2026, 2027, 2028, 2029, 2030 -2050")


