


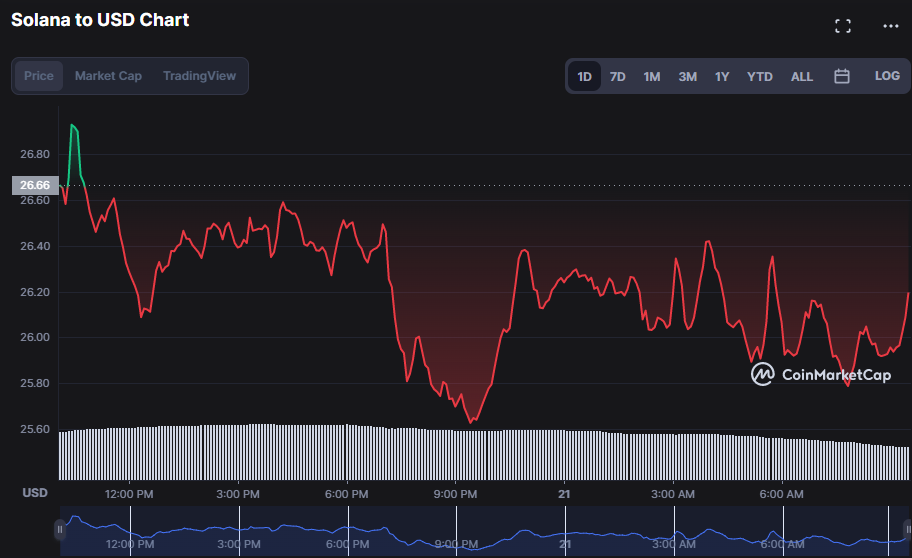
- SOL’s bullish efforts propel the price to a new 90-day high.
- During the dip, the SOL market finds support around $25.24.
- Bulls may have a chance to correct, according to indicators.
The price of Solana (SOL) has ridden the bull’s back during the last day, reaching a new 90-day high of $26.93. As a result of selling pressure, bulls retreated, and the bears pushed the price down to an intraday low of $25.63. At the time of publication, the negative outlook has caused the price of SOL to drop by 2.17% to $26.03.
There was a drop of 2.38% in market capitalization to $9,842,288,961 and a drop of 33.66% in trading volume to $1,032,043,914 during the downturn. As low trade volumes indicate investors’ unwillingness to join the market, this drop reflects a widespread lack of investor confidence. Investor disinterest in SOL after its recent all-time high is likely to blame for the current round of selling.
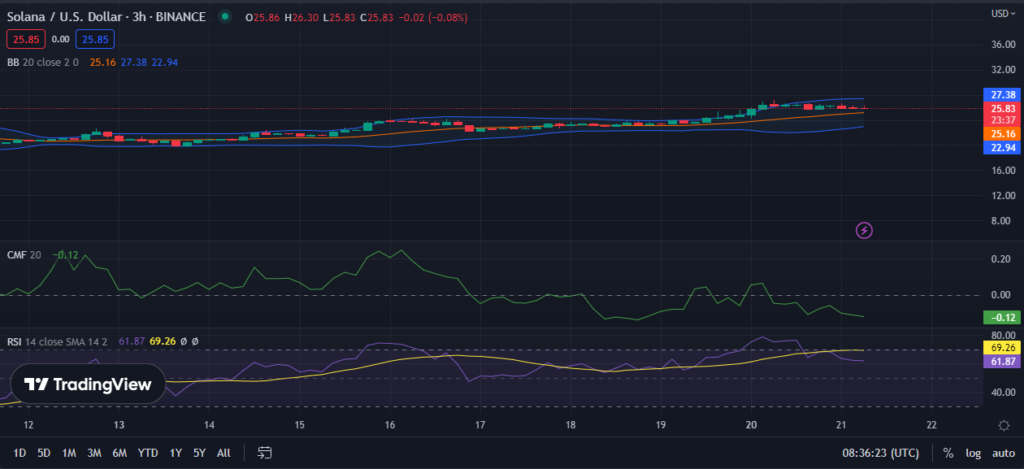
With the upper Bollinger band at $27.40 and the lower band at $22.94, bullish momentum in SOL may rise as the bars move higher. With the BBs taking this action, it is more likely that the SOL market will reverse to the upside. However, the development of a bullish green candlestick pattern and the price action’s subsequent rise toward the upper band indicates that the market is about to turn around.
Traders should be wary as the SOL market bears seem to be in control with a Chaikin Money Flow (CMF) rating of -0.07. Although it is now moving higher, a bullish reversal will occur if it crosses the zero line, bolstering traders’ hope of a bull run soon.
With an RSI reading of 62.73 below the signal line, the SOL market’s negative momentum may continue. However, this shift indicates sellers are in a stronger position than buyers dimming hopes of a turnaround.
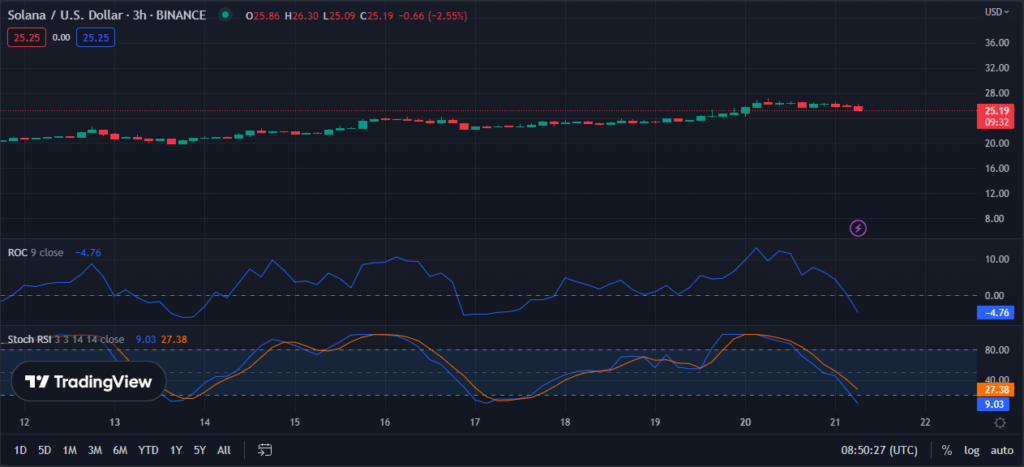
In the 3-hour price chart for SOL, the Rate of Change (ROC) indicator heads south to a score of -2.19, signifying the growing bearishness. This decline into the red zone warns buyers that the SOL market’s downward momentum will prolong if the bulls don’t keep fighting.
Indicating extreme market bearishness, the SOL’s stochastic RSI is now 9.03 and declining, placing it below its signal line. As an oversold zone often suggests that a market trend is about to cease, this level indicates that the market is oversold, and a possible reversal is on the horizon.
Indicators points to a possible turnaround if the bullish strength is to reassert itself in the SOL market.
Disclaimer: The views and opinions, as well as all the information shared in this price prediction, are published in good faith. Readers must do their research and due diligence. Any action taken by the reader is strictly at their own risk. Coin Edition and its affiliates will not be held liable for any direct or indirect damage or loss.
Disclaimer: The information presented in this article is for informational and educational purposes only. The article does not constitute financial advice or advice of any kind. Coin Edition is not responsible for any losses incurred as a result of the utilization of content, products, or services mentioned. Readers are advised to exercise caution before taking any action related to the company.


