


- RNDR bears hold sway as support at $1.94 holds.
- Increased trading volume indicates active participation despite price decline.
- Bullish signs emerge as RNDR’s negative sentiment dissipates.
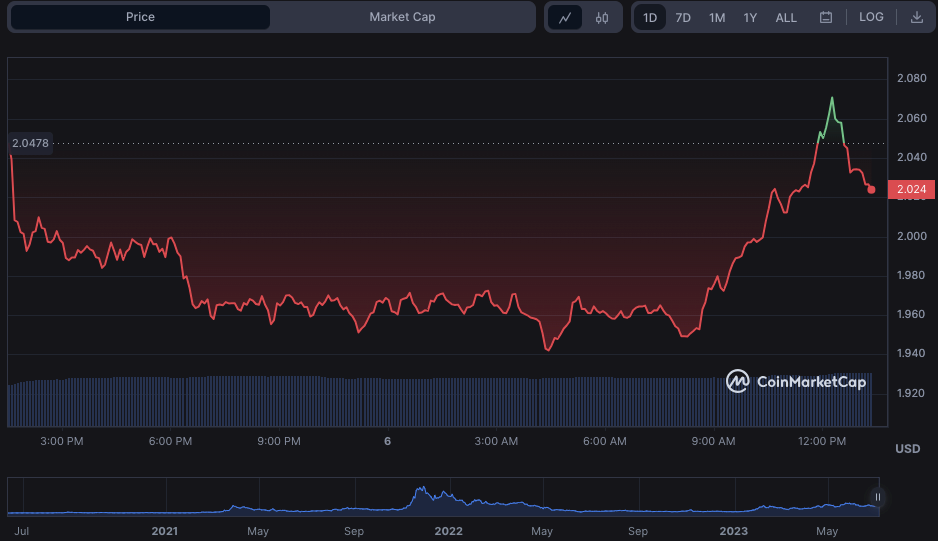
In the last 24 hours, bears have had the upper hand in the Render Token (RNDR) market, with the $1.94 support preventing further decline. Bullish attempts to resume control over the market were met with resistance at the intra-day of $2.07, causing a reversal in the price action. Consequently, bears resumed dominance, pushing the price to $2.03, a 0.82% decline as of press time.
While the RNDR’s market capitalization dipped by 0.78% to $747,175,272, the 24-hour trading volume surged by 28.42% to $55,371,815. This move suggests that there has been increased trading activity in the RNDR market despite the price decline. The rise in trading volume indicates significant buying and selling pressure, with traders actively participating in the market.
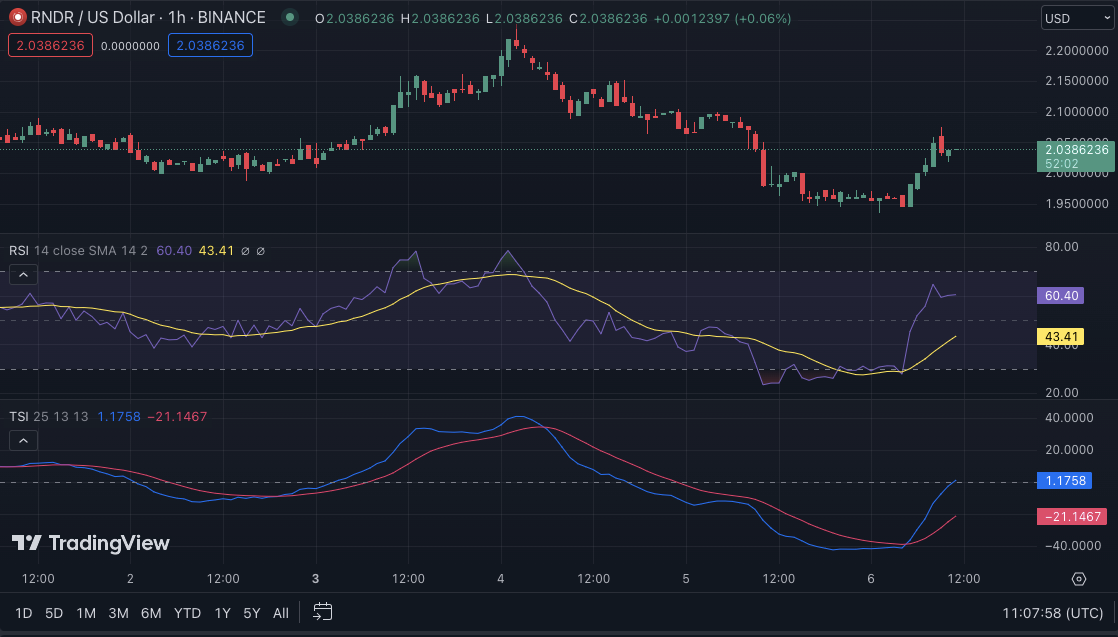
The Relative Strength Index (RSI) rating of 60.09 suggests that the bearish momentum in the RNDR market may be weakening. A reading above 50 indicates bullishness, while a reading below 50 suggests bearishness.
With an RSI of 60.09, the market is still in a positive zone, however, significantly weaker. This level could indicate that investors are starting to regain confidence in RNDR and are buying at lower prices.
The True Strength Index (TSI) rating of 1.1756 and pointing upwards suggests that the negative sentiment in the RNDR market is also starting to dissipate. The TSI measures the strength of a security’s price movement and indicates whether it is overbought or oversold.
A TSI rating above 1 indicates bullishness, while a below 1 suggests bearishness. With a TSI rating of 1.1756 and pointing upwards, it implies that the selling pressure in RNDR is easing, and buyers are stepping in. This level aligns with the RSI rating, further supporting that the bearish momentum may weaken.
In conclusion, RNDR’s market shows signs of bullish resilience despite recent bearish pressure, with increasing trading volume and indicators suggesting a weakening bearish momentum.
Disclaimer: The views, opinions, and information shared in this price prediction are published in good faith. Readers must do their research and due diligence. Any action taken by the reader is strictly at their own risk. Coin Edition and its affiliates will not be liable for direct or indirect damage or loss.
Disclaimer: The information presented in this article is for informational and educational purposes only. The article does not constitute financial advice or advice of any kind. Coin Edition is not responsible for any losses incurred as a result of the utilization of content, products, or services mentioned. Readers are advised to exercise caution before taking any action related to the company.


