


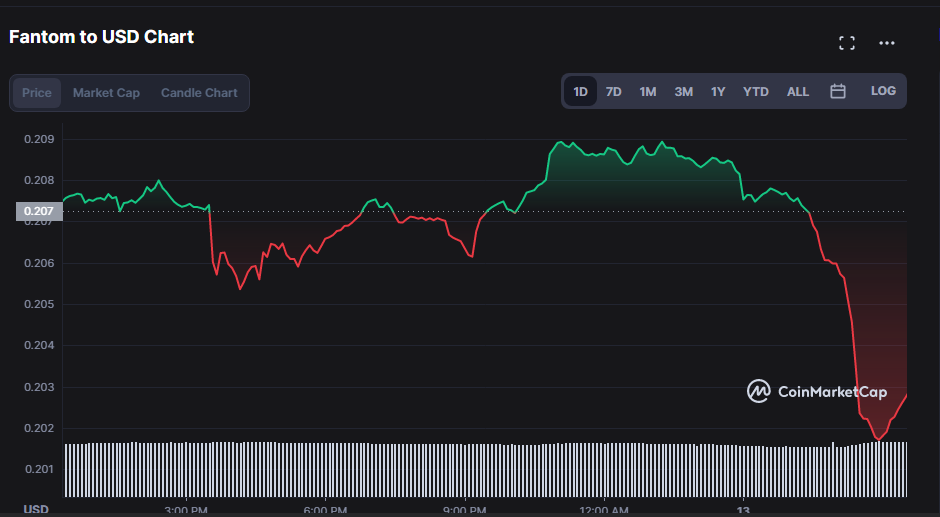
- FTM loses 5.51% of its recouped value.
- As FTM prices continue to fall, bears are in charge.
- At $0.1976, Fantom finds support.
Following a brief upward momentum in the 24-hour price chart as the price retracted from its $0.2089 peak, Fantom (FTM) price has significantly dropped in the past few hours. FTM hit a high of $0.2089 during the most recent price surge before running into strong opposition, which caused it to lose some of its value.
FTM experienced support during the decline at $0.1997, falling 5.51%, at press time. The coin’s market capitalization is $515,082,842, 2.29 % down from its last data, and its trading volume is $67,466,829. This represents an increase of 2.07%.
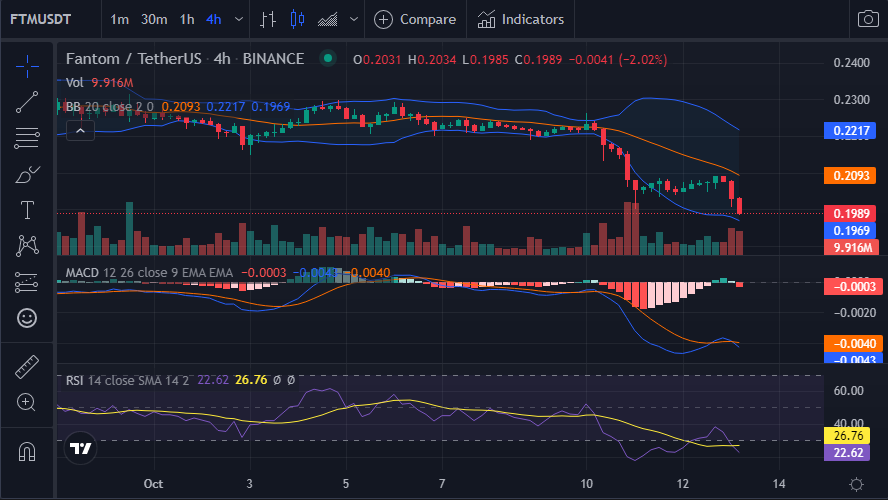
Intense selling pressure has characterized the last few hours’ price movement of Fantom (FTM), which has led to a 3.89% drop in price. Technical indicators show that the bears have taken control of the market, and this downward trend may continue.
The bearish momentum has increased as a result of the MACD blue line crossing the signal line and moving into the negative area. Traders are deciding to sell Fantom (FTM) as a result of this move into the negative territory since the MACD line is now at -0.0042 and below the signal line, which is at -0.0040. This denotes a downward price movement and further increases the selling pressure.
The tightening of the Bollinger bands indicates a period of minimal volatility. The likelihood of severe price action in either direction increases as a result of this movement. However, the market is moving towards the lower Bollinger band, which indicates a price decline as the FTM turns oversold. The upper and lower bands touched 0.2217 and 0.1971, respectively.
Adding on, the Relative Strength Index (RSI) is almost in the oversold area with a reading of 23.01. The RSI position on the 4-hour price chart suggests that there is still more room for FTM prices to maintain the downward trend as the bears seize control of the market.
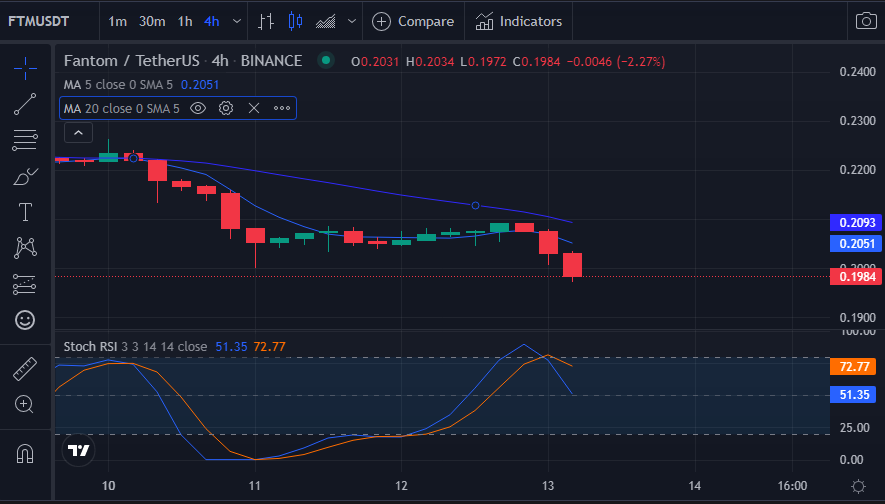
The short-term MA is crossing below the longer-term MA in a bearish crossover as clear from the 5-day and 20-day Moving Averages. In the 4-hour price chart, the 5-day MA touches 0.2050 and the 20-day MA touches 0.2093.
The Stoch RSI has a value of 50.63 and is heading south because it recently crossed the overbought zone, indicating that prices are about to turn lower.
In general, the bulls must sustain the resistance level and raise prices to overturn the negative trend on the FTM trading pattern.
Disclaimer: The views and opinions, as well as all the information shared in this price analysis, are published in good faith. Readers must do their own research and due diligence. Any action taken by the reader is strictly at their own risk, Coin Edition and its affiliates will not be held liable for any direct or indirect damage or loss.
Disclaimer: The information presented in this article is for informational and educational purposes only. The article does not constitute financial advice or advice of any kind. Coin Edition is not responsible for any losses incurred as a result of the utilization of content, products, or services mentioned. Readers are advised to exercise caution before taking any action related to the company.


