


- BTC’s dominance is gaining momentum in the past few hours.
- If BTC’s 9 EMA cross the 20 EMA on the 4h chart, it could signal a price spike.
- BTC is in a consolidation channel on the daily chart as it waits for the perfect timing to enter into a rally.
The crypto and market education platform IncomeSharks took to Twitter on October 13 to add to a previous post about Bitcoin (BTC) and its dominance and the effect this has on altcoins.
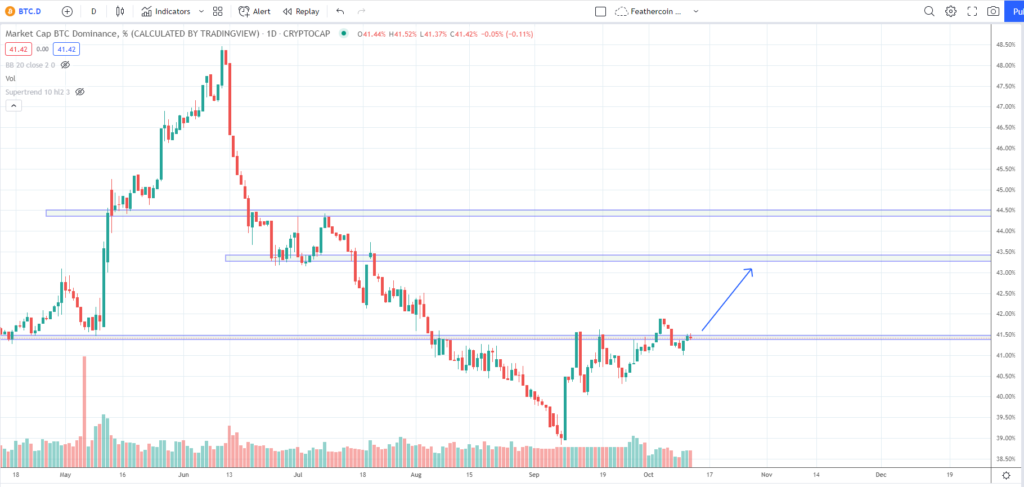
The most recent post states that altcoins are breaking down, which is good news for the crypto market leaders as its dominance is now pushing up. These are the perfect conditions for a BTC rally as more money flows into one asset.
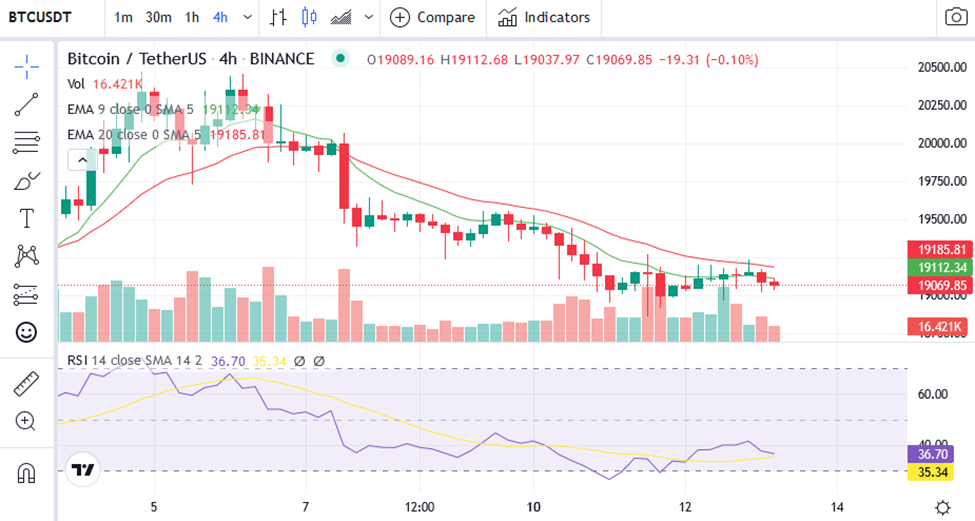
BTC’s price is in a dance with the 9 Exponential Moving Average (EMA) line as it struggles to make a successful move above the line – causing downward price movement over the last two days.
There are early signs that suggest that BTC is preparing for a rally, at least on the 4 hour chart. One such sign is the narrowing gap that currently exists between the 9 and 20 EMA lines. Should the 9 EMA line cross above the 20 EMA line on BTC’s 4 hour chart, then it will be a strong signal for a quick price spike and profit-taking opportunity.
Furthermore, if the Relative Strength Index (RSI) indicator bounces off of the RSI SMA line to see its gradient turn positive, then investors and traders can look to enter into a long position for the crypto market leader.
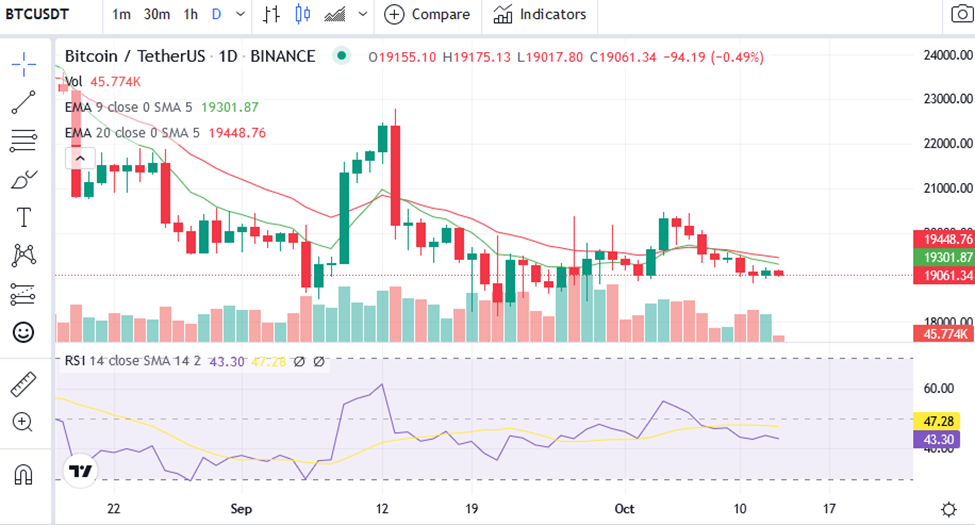
The price of BTC is in a consolidation channel on the daily chart as the coin waits for the perfect timing to enter into a rally. This can also be seen by the slope of the daily RSI which has been almost flat for the last two to three days.
Traders need to keep an eye on the lower time frames at this point to identify the perfect entry, as events on the smaller time frame charts will trickle over to the daily chart in the coming days.
Disclaimer: The views and opinions, as well as all the information shared in this price analysis, are published in good faith. Readers must do their own research and due diligence. Any action taken by the reader is strictly at their own risk. Coin Edition and its affiliates will not be held liable for any direct or indirect damage or loss.
Disclaimer: The information presented in this article is for informational and educational purposes only. The article does not constitute financial advice or advice of any kind. Coin Edition is not responsible for any losses incurred as a result of the utilization of content, products, or services mentioned. Readers are advised to exercise caution before taking any action related to the company.


