


- Binance Coin price analysis is been bearish recently.
- Resistance for BNB/USD is found at $246.60.
- BNB/USD has support at $243.13.
Binance Coin (BNB) price analysis shows that its price is bearish today. Binance Coin has primarily traded in the red over the past week, and its price has been steadily falling. The BNB price failed to maintain its upward trend and fell to $245.87 yesterday. before rising to $244.13, at the time of writing. The price has dropped by more than 0.33%. BNB may move lower over the next 24 hours to test support at $243.14, if a bearish momentum persists and the price is unable to rise above the 9- and 21-day moving averages.
The one-day BNB price analysis reveals that the market is currently in a negative trend as a decrease in coin value is seen. At the beginning of the week, the price had a comeback, but now the downward trend is becoming more pronounced. The short-term trend line is currently once again declining. At the time of writing, the BNB/USD exchange rate is down 0.33 percent, hovering at $243.13. Currently, the price is below its moving average.
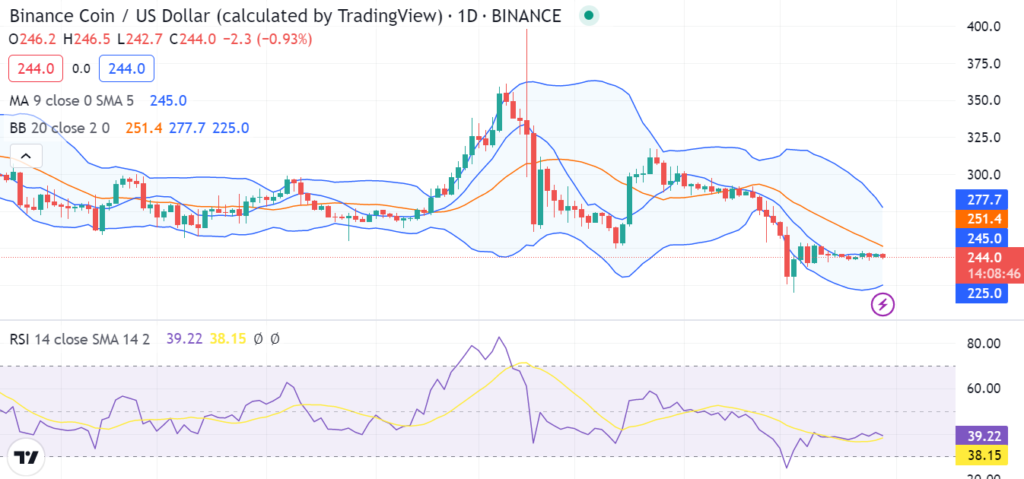
The Relative Strength Index score for BNB Chain is 38.15, which indicates that the market has remained oversold for a significant portion of the day and is incredibly low. The bulk of technical indicators point to a bearish trend. The last few days have had wide Bollinger Bands. At press time, the indicator’s lower line offers support at $225.0, and its upper limit shows a level of resistance at $251.1.
The MACD line (blue) is below the signal line, indicating falling signals (red). Additionally, the price is trading below the histogram, indicating a strong negative trend.
On a 4-hour chart, Binance Coin confirms that its price is going down again after a brief escape. The bears are pulling down the price levels, and currently, they have reached the $243.13 level. The moving average is still above the current price, i.e., at $245.01, because of the bearish trend that followed in the last two days.
Overall, the BNB analysis is contributing to the selling pressure as a result of the ongoing drop of the coin. The price decreased to $243.13 from the previous day as the bears were still in control of the market today. If the $243.13 support level holds firmly, the bearish pressure might increase and drive prices much lower. However, buyers might seek a higher price entry point if the resistance level of $246.60 is surpassed in the following weeks.
Disclaimer: The views and opinions, as well as all the information shared in this price analysis, are published in good faith. Readers must do their own research and due diligence. Any action taken by the reader is strictly at their own risk, Coin Edition and its affiliates will not be held liable for any direct or indirect damage or loss.
Disclaimer: The information presented in this article is for informational and educational purposes only. The article does not constitute financial advice or advice of any kind. Coin Edition is not responsible for any losses incurred as a result of the utilization of content, products, or services mentioned. Readers are advised to exercise caution before taking any action related to the company.


 Price Prediction 2026, 2027, 2028, 2029, 2030-2050")

