


- Kaiko announced on X that one of Binance’s hot wallets briefly took the lead as the highest consumer of gas on the Ethereum network.
- The price of ETH was able to climb by more than 1% over the past day of trading.
- At press time, ETH was resting on the crucial support level of $1,580.
The analytics platform Kaiko announced on X that one of Binance’s hot wallets briefly took the lead as the highest consumer of gas on the Ethereum (ETH) network. Binance attributed this surge in gas consumption to its efforts to consolidate ETH balances.
On Sep. 23, the market intelligence platform Santiment shared a post on X that the Ethereum network’s fees have dropped to their lowest levels in 2023, at just $1.15 per transaction. This reduction in gas fees may lead to increased utility levels, subsequently resulting in an increase in the market cap for ETH.
ETH was trading at $1,588.11 at the time of writing, which reflected a modest 0.62% price increase within the past day of trading. This put ETH in close proximity to its 24 hour high of $1,595.84. However, the intraday trading volume for ETH saw a contrasting trend after it experienced a more than 7% decline. This left its trading volume standing at $3,705,624,372.
Despite the 24-hour gain, ETH’s price did end up slipping by more than 2% over the past seven days. Additionally, the leading altcoin suffered losses of 3.69% over the past month of trading as well.
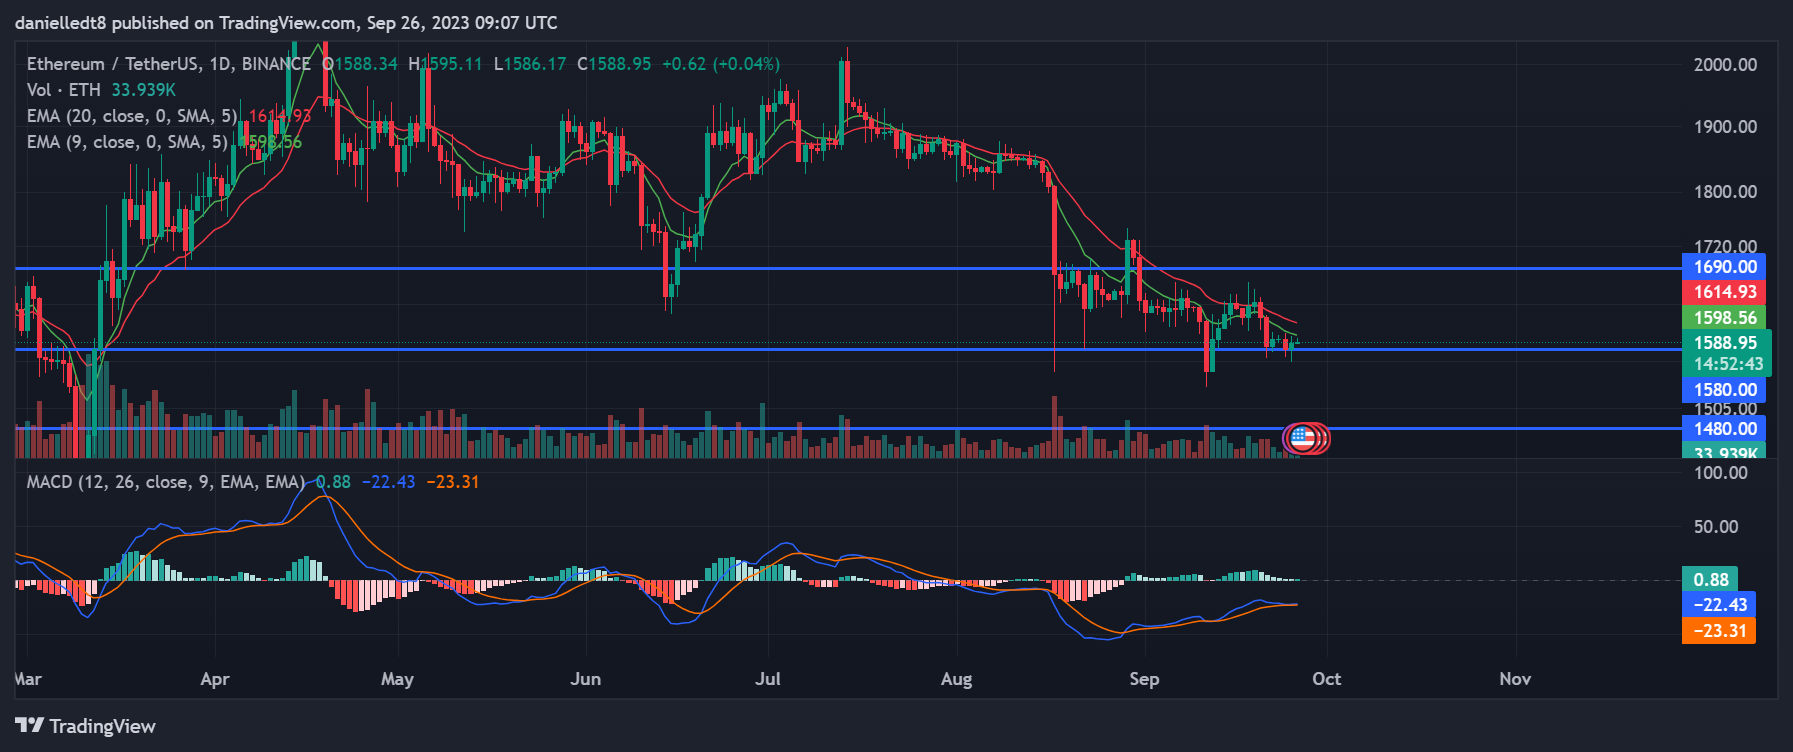
At press time, ETH was resting on the crucial support level of $1,580. If it breaks below this significant price point, then it may continue to drop to the subsequent mark at $1,480 in the following few days. Conversely, ETH maintaining a position above $1,580 for the next 48 hours may lead to the altcoin leader’s price climbing towards the $1,690 resistance.
Investors and traders will want to take note of the fact that technical indicators on ETH’s daily chart suggest the crypto’s price may drop in the next couple of days. At press time, the 9-day EMA line was positioned below the 20-day EMA line.
In addition to the bearish orientation of the 9-day and 20-day EMA lines, the daily MACD line was on the cusp of crossing below the daily MACD Signal line. Should these two technical indicators cross, it may suggest a continuation of ETH’s bearish momentum.
Disclaimer: The views and opinions, as well as all the information shared in this price analysis, are published in good faith. Readers must do their own research and due diligence. Any action taken by the reader is strictly at their own risk. Coin Edition and its affiliates will not be held liable for any direct or indirect damage or loss.
Disclaimer: The information presented in this article is for informational and educational purposes only. The article does not constitute financial advice or advice of any kind. Coin Edition is not responsible for any losses incurred as a result of the utilization of content, products, or services mentioned. Readers are advised to exercise caution before taking any action related to the company.
 Price Prediction 2026, 2027, 2028, 2029, 2030 -2050")


