


- Topcaller.sol gains from meme coins with a 0.13% win rate.
- SOL sees price surge despite month-long bearish trend.
- Technical indicators indicate strong bullish momentum for SOL.
In a demonstration of risk and reward, an investor known as topcaller.sol has made major gains by trading meme cryptocurrencies, colloquially known as “meme coins.” Since April 9, topcaller.sol has invested in 5,417 meme coins, each purchase averaging 0.215 Solana (SOL).
This approach yielded substantial returns, with seven of these investments achieving a return on investment (ROI) exceeding 1000%, culminating in a total profit of 290 SOL. According to Lookonchain, the success of topcaller.sol’s trading strategy draws comparisons to purchasing lottery tickets, given the low win rate but high potential returns. The data further reveals that only 0.13% of the MEMEcoin purchases resulted in the aforementioned high profits.
SOL Price Action
Despite experiencing a bearish trend over the past month, Solana (SOL) has witnessed a significant uptick today, May 6, injecting a wave of optimism into its market performance. This surge reflects broader bullish sentiment across the global cryptocurrency landscape, with SOL’s price increasing markedly within the last 24 hours.
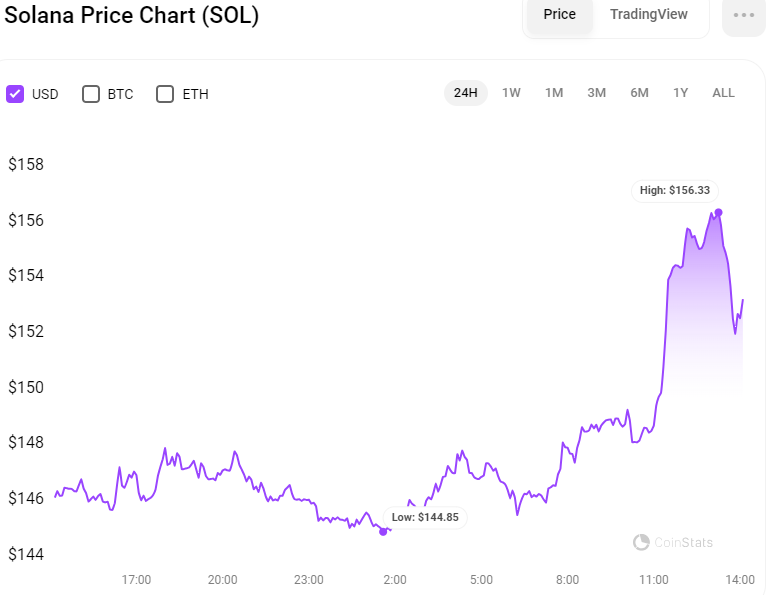
As of press time, the SOL token is trading at $152.61, marking a 4.55% rise from the previous day. Alongside this price increase, Solana’s market cap has climbed by 5.46% to reach $69.03 billion.
However, the trading volume tells a different story, showing a 32.21% decrease to $1.98 billion. This reduced trading activity suggests cautious approaches by investors as SOL approaches the critical resistance level of $159.
On the 4-hour chart, the SOL token is exhibiting strong upward momentum as it approaches the $159 resistance level. Should this bullish trend persist in the short term, SOL prices could not only breach this initial resistance but also potentially ascend toward the next significant resistance mark at $176.12.
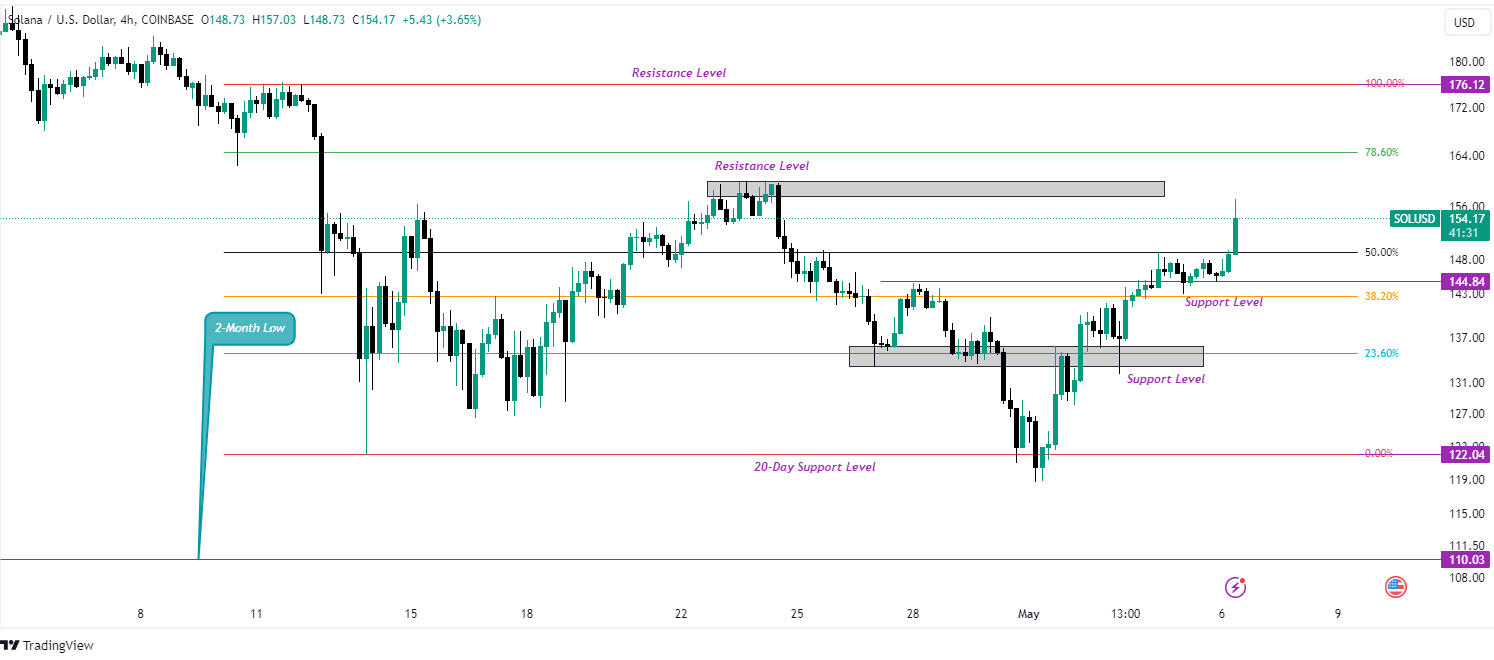
Conversely, if the SOL token encounters a downturn and breaches the 50% Fibonacci retracement level, prices might retest the support at $144.84 before attempting to recover back toward the resistance. A failure to hold this support level could lead to further declines, potentially driving the price down towards the $135 support zone, with a risk of falling even lower.
Technically, the Moving Average Convergence Divergence (MACD) indicator reinforces this bullish outlook. Positioned at 3.20, with the MACD line above the signal line and pointing upwards, it suggests that bullish momentum is gaining strength. This is further supported by widening green bars on the MACD’s histogram, indicating a strengthening of this upward trend.
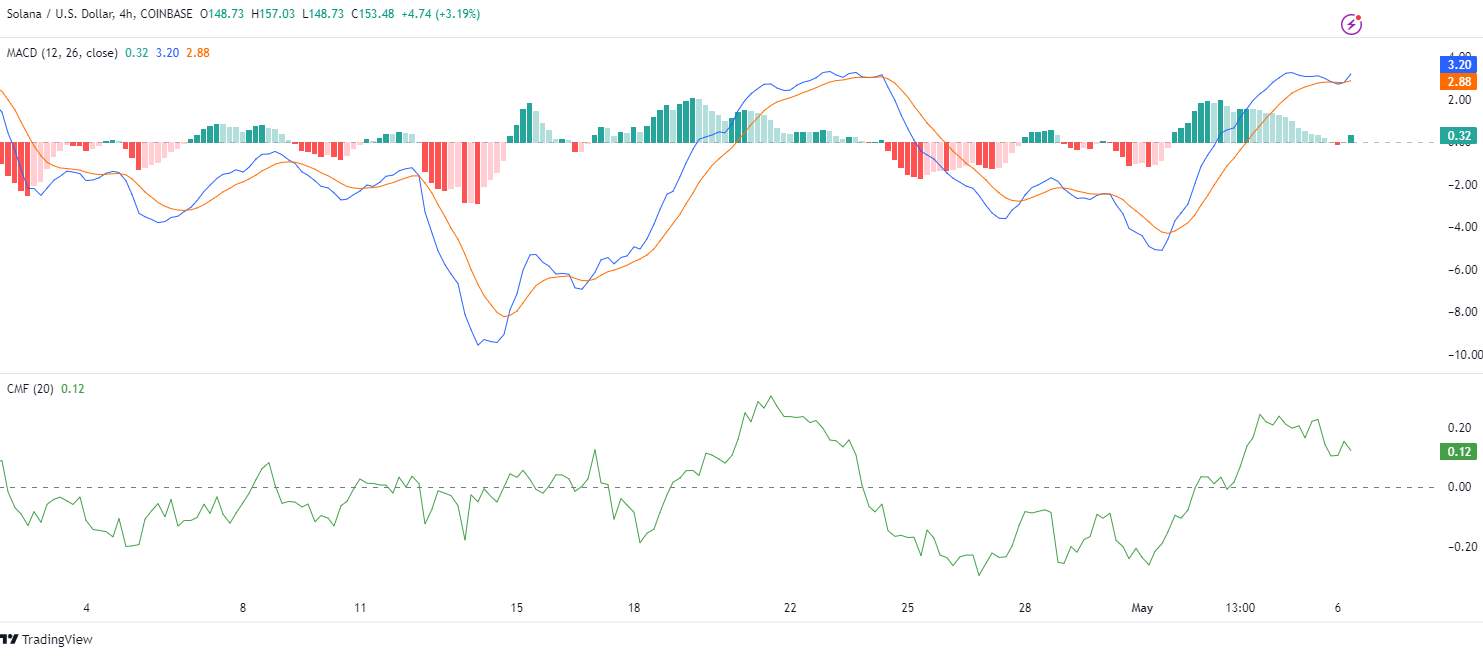
Simultaneously, the Chaikin Money Flow (CMF) indicator is at 0.12, signifying a strong inflow of money into the market. This indicates increased buying pressure, which could further support the price’s upward trajectory.
Disclaimer: The information presented in this article is for informational and educational purposes only. The article does not constitute financial advice or advice of any kind. Coin Edition is not responsible for any losses incurred as a result of the utilization of content, products, or services mentioned. Readers are advised to exercise caution before taking any action related to the company.
: What Happens If You Use an Unlicensed Platform?")


