


 Set to Cross Yearly High By March, Report States")
- The MACD turned negative, suggesting bearish momentum for BTC.
- A close above the $52,051 resistance could trigger a 26% Bitcoin rally.
- The report stated that interest rate cuts, alongside other factors, could drive BTC to $63,000.
According to a report released by Matrixport, Bitcoin’s (BTC) price could hit $63,000 by March 2024. It is important to note that the digital asset management firm did not conclude without some reasons.
In the report, Matrixport stated that there were underlying factors that could drive BTC higher than it currently is. One of the catalysts stated includes the approval of the spot Bitcoin ETF. Others were the potential interest rate cuts by the FOMC, the upcoming Bitcoin halving, and the 2024 U.S. presidential elections.
Bitcoin to Fall First
Bitcoin’s price at press time was $51,043. Therefore, Matrixport’s prediction meant that the coin could add another 26% before halving. From a technical point of view, BTC’s price could slip below $51,000 in the short term.
This was because the Moving Average Convergence Divergence (MACD) had fallen into the negative region. This decline implies increasing bearish momentum, which could drive a downward price movement.
If BTC falls, bulls would need to defend the critical support at $47,764. The ability to defend this region could trigger a rebound for the coin. But if Bitcoin does not drop that low, bulls would need to breach the overhead resistance of $52,051.
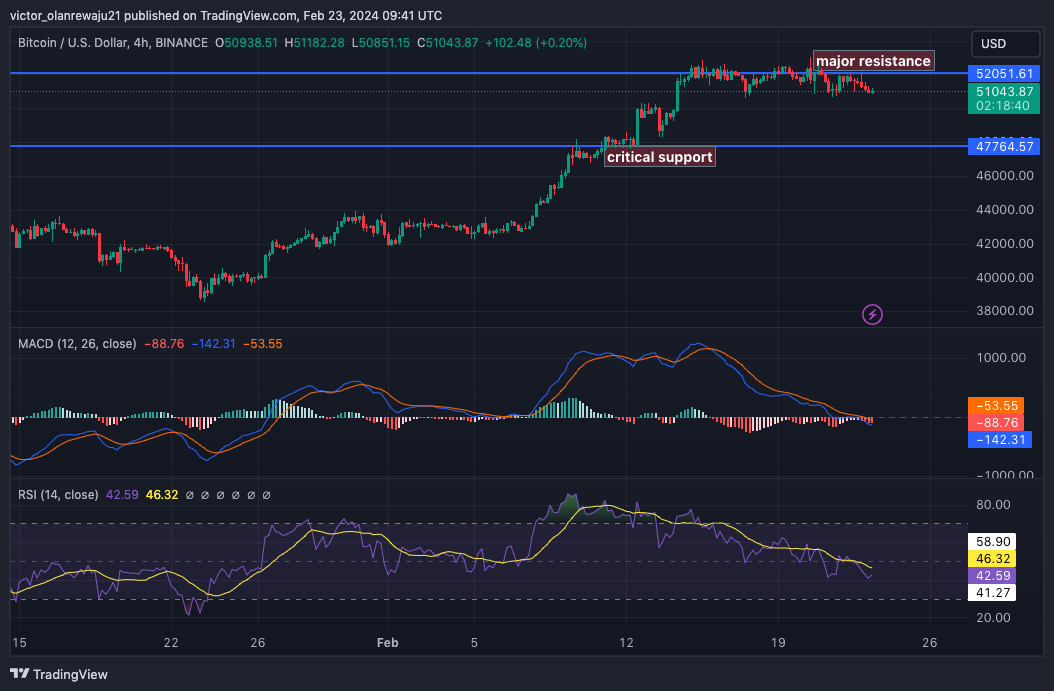
BTC/USD 4-Hour Chart (Source: TradingView)
Bullish Signals Appear
A successful break of the resistance could drive BTC toward $60,000. But if it gets rejected again, the coin could drop below $50,000. However, the RSI reading fell, indicating declining buying momentum.
If the reading drops below 40.00, then Bitcoin might fall to $49,000. However, indications from the daily chart showed that a price increase was possible. This was because of the signals shown by the Exponential Moving Average (EMA).
At press time, the 20 EMA (blue) had crossed over the 50 EMA (yellow). Also, the daily BTC/USD chart revealed that the coin price had risen above both EMAs. This suggests a bearish thesis for Bitcoin in the short to mid-term.
If this position remains the same going forward, then BTC could add 26% to its value within a month. But if the 50 EMA flips the 20 EMA, the bullish bias could be invalidated.
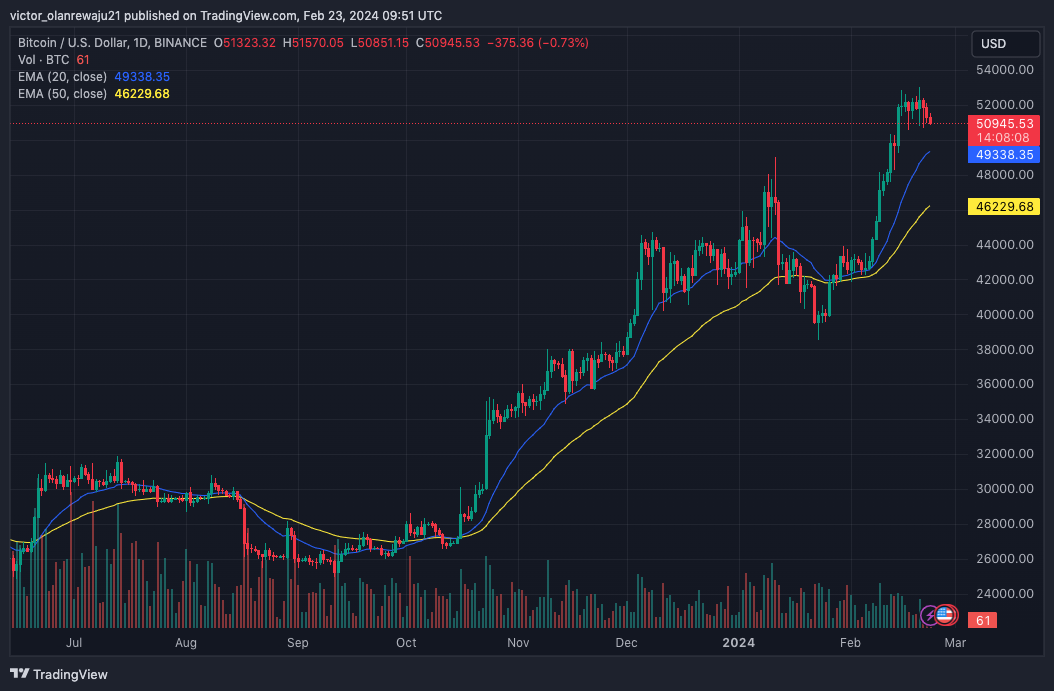
BTC/USD Daily Chart (Source: TradingView)
Going forward, traders might also need to watch out for the outcome of the FOMC meeting. Should the Fed decide to cut interest rates, then Bitcoin might enjoy an inflow of liquidity, which could drive the price higher. However, if interest rates remain the same or increase, Bitcoin’s price might slide.
Disclaimer: The information presented in this article is for informational and educational purposes only. The article does not constitute financial advice or advice of any kind. Coin Edition is not responsible for any losses incurred as a result of the utilization of content, products, or services mentioned. Readers are advised to exercise caution before taking any action related to the company.


