


- Bitcoin revisits a key Binance fund flow “decision zone” linked to past market turning points.
- Similar conditions in 2019 and 2020 preceded consolidation phases and major bull market expansions.
- BTC falls below key technical levels as ETF outflows and weak demand add pressure.
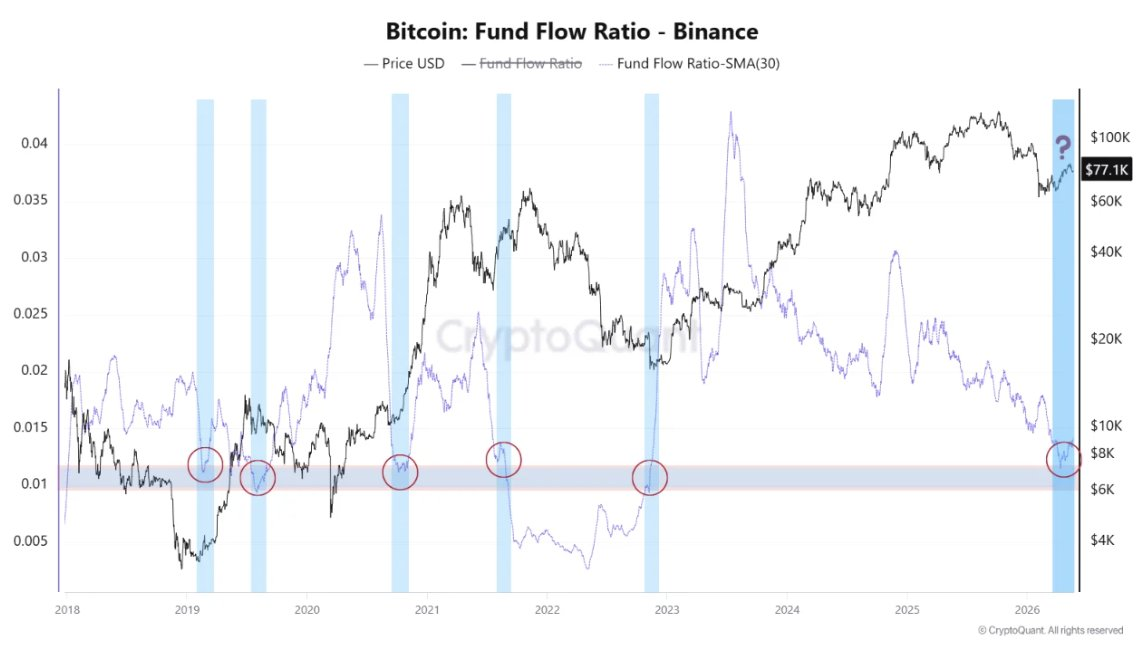
The Bitcoin Fund Flow Ratio on Binance has returned to a level that has often come before major market turning points, according to CryptoQuant analyst MorenoDV.
The metric is now in the 0.010–0.012 range for the sixth time since 2018, a zone that has previously appeared near market bottoms and trend changes.
The indicator tracks how much Bitcoin is moving through exchanges compared to total network activity. Higher readings usually signal more trading, speculation, and profit-taking. Meanwhile, lower readings suggest less exchange activity and weaker selling pressure.
In the past, moves into this range have often come before a shift in market direction.
Source: X
Historical Patterns Point to Potential Recovery Setup
MorenoDV noted that similar conditions were seen in early 2019 after the 2018 bear market. At that time, exchange activity had dropped sharply while Bitcoin traded near cycle lows. This suggested that sellers were losing momentum, and fewer coins were being moved for trading.
A similar setup also appeared in 2020 before Bitcoin’s major bull run. During that phase, Binance’s Fund Flow Ratio stayed low while Bitcoin consolidated. When demand returned, the ratio rose quickly as traders re-entered the market to catch the uptrend.
The analyst said Bitcoin is now in another “decision zone,” where the market could either stay weak or start building a base for a recovery if selling pressure fades further.
Bitcoin Slides Below Key Technical Levels
At press time, Bitcoin is under pressure in the broader market. According to CoinMarketCap data, BTC fell 3.63% in the past 24 hours to $74,528.82, underperforming the wider crypto market amid ongoing institutional selling.
The decline also comes as U.S. spot Bitcoin ETFs saw over $1.4 billion in net outflows over the past week, suggesting weaker institutional demand. At the same time, 30-year U.S. Treasury yields rose above 5%, making traditional yield assets more attractive compared to cryptocurrencies, which do not offer yield.
From a technical perspective, Bitcoin has broken below a key rising trendline and is now trading under both its 20-day moving average (~$79,375) and 200-day moving average (~$80,825), strengthening the bearish outlook.
Traders are now focusing on the 50-day moving average around $76,427 and the Fibonacci 78.6% level near $76,635 as key support areas that could decide the next move.
Related: Bitcoin Drops $2,600 After SEC Delays Tokenized Stock Exemption Plan
Disclaimer: The information presented in this article is for informational and educational purposes only. The article does not constitute financial advice or advice of any kind. Coin Edition is not responsible for any losses incurred as a result of the utilization of content, products, or services mentioned. Readers are advised to exercise caution before taking any action related to the company.


