

- Bitcoin’s liquidation map shows a large downside liquidity zone near $74K, increasing pullback risk.
- BTC faces immediate resistance at $84.5K–$85.2K, where a breakout could trigger a short squeeze.
- Price is caught between key support and heavy leverage on both sides, setting up a volatility spike.
Bitcoin surged to multi-month highs this week, testing levels not seen since January, as it fell deep into the crypto winter. The latest rally rekindled BTC’s bullish momentum, changed the crypto market narrative, and boosted traders’ bullish sentiment.
Bitcoin’s Massive Liquidation Setup
Just days after an impressive run, Bitcoin’s dynamics suggest a potential return to lower levels. Its current liquidation setup raises the possibility of a pullback toward the $74,000 area, particularly if leveraged positions begin getting flushed and downside momentum accelerates.
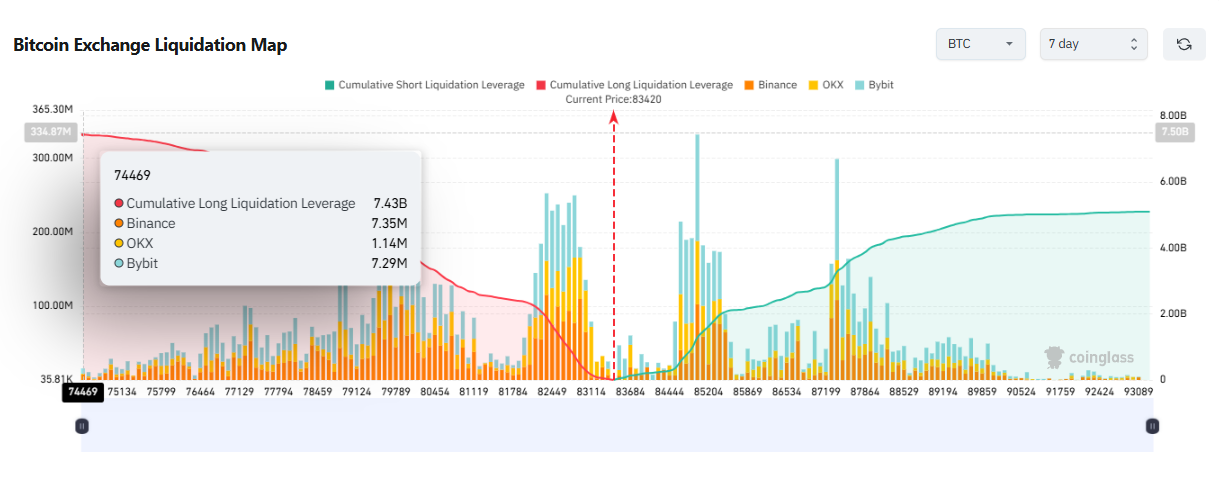
On-chain data reflects a massive $7.43 billion liquidation level, leaving a liquidity gap that could fuel another downside sweep before the cryptocurrency attempts a rebound. With Bitcoin trading at $83,979 at the time of writing, the cryptocurrency’s immediate supply wall is around $84,500-$85,200. BTC would need to reclaim this level to neutralize a potential short-term pullback.
Bitcoin’s Technical Levels and Liquidity Clusters
Meanwhile, Bitcoin has tested an immediate demand floor between $82,500 and $83,000, which aligns with previous key pivots. Buyers aggressively defended this level during the initial test, keeping the short-term bullish trend intact. Falling below this support would suggest that buyers are losing control of immediate price direction.
Bitcoin now sits between competing liquidity zones. While downside levels near $74,000 remain vulnerable to liquidation pressure, a build-up of short positions above $84,200 could trigger a squeeze if price breaks higher. With a major BTC options expiry on September 25, both directions remain in play as volatility picks up.
Which Way For Bitcoin?
Bitcoin’s next move now depends on how price reacts around key liquidity zones. A break below the $82,500–$83,000 support range could accelerate downside momentum, opening the path toward deeper liquidity pockets near $74,000. On the other hand, a decisive move above the $84,500–$85,200 resistance zone could invalidate the immediate pullback scenario and trigger a short squeeze.
With leveraged positions building on both sides, the market appears positioned for a volatility-driven move rather than a steady trend. The direction will likely be determined by which side of the market loses control first.
Related: Bitcoin Tests $83K as Bond Yields Surge: Will Rising Rates Push BTC Toward $80K?
Disclaimer: The information presented in this article is for informational and educational purposes only. The article does not constitute financial advice or advice of any kind. Coin Edition is not responsible for any losses incurred as a result of the utilization of content, products, or services mentioned. Readers are advised to exercise caution before taking any action related to the company.